The page that you are currently viewing is for an old version of Stroom (7.1). The documentation for the latest version of Stroom (7.12) can be found using the version drop-down at the top of the screen or by clicking here.
Feeds
Getting data into Stroom
Create the feed
Stroom organises the data it ingests and stores by Feed . A feed will typically be created for each client system and data format.
Data is sent to a Stroom feed using a POST to the /datafeed
API
.
We will use curl to represent a client system sending data into Stroom.
Warning
The stroom_core_test stack that you are running includes a copy of the content created by this quick start guide in the folder Stroom 101. If you want to skip the steps involving creating content then you can just use the pre-loaded Stroom 101 content. To delete the folder and all its content, right-click on it and then click delete.
We think you will learn more by deleting this pre-loaded content and following all the steps.
-
A lot of Stroom’s functionality is available through right-click context menus. If you right-click
 System in the tree you can create new child items.
Create a new folder by selecting:


Call it something like
Stroom 101: -
Right-click on the new
Stroom Quick Start folder then select this to create a feed:

The name needs to be capitalised and unique across all feeds. Name it
CSV_FEED.This will open a new tab for the feed.
-
We want to emulate a client system sending some data to the feed, so from the command line do
Download mock_stroom_data.csv to your computer. Then open a terminal session and change directory to the location of the downloaded file.
The -H arguments add HTTP headers to the HTTP POST request.
Stroom uses these headers to determine how to process the data, see Header Arguments for more details.
In this example we used
/datafeeddirectrather than/datafeed.
The former goes directly into Stroom, the latter goes via Stoom Proxy where it is aggregated before being picked up by Stroom.
That’s it, there’s now data in Stroom.
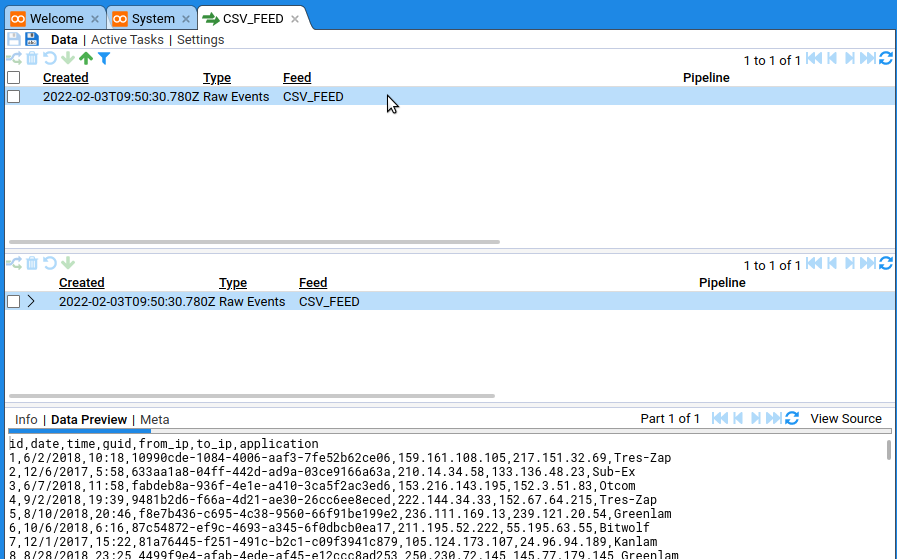
In the CSV_FEED tab, ensure the Data sub-tab is selected then click the new entry in the top pane and finnaly click the
 button:
You should be able to see it in the data table in the bottom pane.
button:
You should be able to see it in the data table in the bottom pane.
Now you can do all sorts of things with the data: transform it, visualise it, index it. It’s Pipelines that allow all these things to happen.