This is the multi-page printable view of this section.
Click here to print.
Return to the regular view of this page.
How Tos
This is a series of HOWTOs that are designed to get one started with Stroom. The HOWTOs are broken down into different functional concepts or areas of Stroom.
Note
These HOWTOs will match the development of Stroom and as a result, various elements will be updated over time, including screen captures.
In some instances, screen captures will contain timestamps and so you may note inconsistent date or time movements within a complete HOWTO, although if a sequence of captures is contained within a section of a document, they all will be replaced.
General
Raw Source Tracking show how to associate a processed Event with the source line that generated it.
Other topics in this section are
- Feed Management.
- Tasks
- Moving Object in Explorer
- Enabling Processors
Administration
HOWTO documents that illustrate how to perform certain system administration tasks within Stroom: Manage System Properties
Authentication
Contains User Login, User Logout, Create User HOWTO documents.
Installation
The Installation Scenarios HOWTO is provided to assist users in setting up a number
of different Stroom deployments.
Event Feed Processing
The Event Feed Processing HOWTO is provided to assist users in setting up Stroom to process inbound event logs and transform them into the Stroom Event Logging XML Schema.
The Apache HTTPD Event Feed is interwoven into other HOWTOs that utilise this feed as a datasource.
Reference Feeds
Reference Feeds are used to provide look up data for a translation.
The reference feed HOWTOs illustrate how to create reference feeds Create Reference Feed and how to use look up reference data maps to enrich the data you are processing Use Reference Feed.
Searches and Indexing
This section covers Indexing and Searching for data in Stroom
Event Post Processing
The Event Forwarding HOWTO demonstrates how to extract certain events from the Stroom event store and export the events in XML to a file system.
1 - General
General How Tos for using Stroom.
1.1 - Enabling Processors
How to enable processing for a Pipeline.
Introduction
A pipeline is a structure that allows for the processing of streams of data.
Once you have defined a pipeline, built its structure, and tested it via ‘Stepping’ the pipeline, you will want to enable the automatic processing of raw event data streams.
In this example we will build on our Apache-SSLBlackBox-V2.0-EVENTS event feed and enable automatic processing of raw event data streams.
If this is the first time you have set up pipeline processing on your Stroom instance you may need to check that the Stream Processor job is enabled on your Stroom instance.
Refer to the Stream Processor Tasks section of the Stroom HOWTO - Task Maintenance
documentation for detailed instruction on this.
Pipeline
Initially we need to open the Apache-SSLBlackBox-V2.0-EVENTS pipeline.
Within the Explorer pane, navigate to the Apache HTTPD folder, then double click on the
 Apache-SSLBlackBox-V2.0-EVENTS Pipeline
to bring up the Apache-SSLBlackBox-V2.0-EVENTS pipeline configuration tab
Next, select the Processors sub-item to show
This configuration tab is divided into two panes.
The top pane shows the current enabled Processors and any recently processed streams and the bottom pane provides meta-data about each Processor or recently processed streams.
Add a Processor
We now want to add A Processor for the Apache-SSLBlackBox-V2.0-EVENTS pipeline.
First, move the mouse to the Add Processor
 icon at the top left of the top pane.
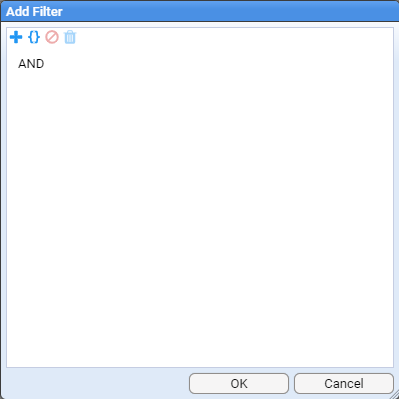
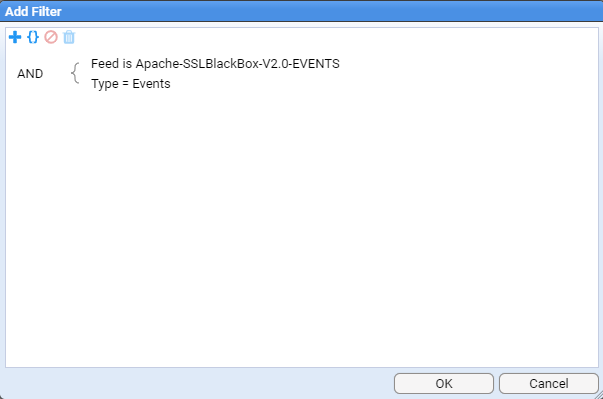
Select by left clicking this icon to display the Add Filter selection window
This selection window allows us to filter what set of data streams we want our Processor to process.
As our intent is to enable processing for all Apache-SSLBlackBox-V2.0-EVENT streams, both already received and yet to be received, then our filtering criteria is just to process all Raw Events streams for this feed, ignoring all other conditions.
To do this, first click on the Add Term
 icon.
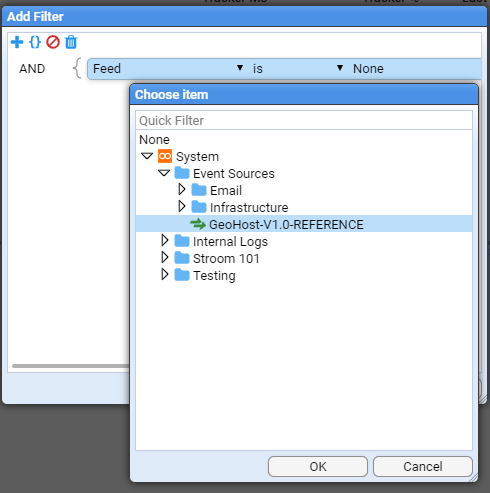
Keep the term and operator at the default settings, and select the Choose item
 icon to navigate to the desired feed name (Apache-SSLBlackBox-V2.0-EVENT) object
and press OK to make the selection.
Next, we select the required stream type.
To do this click on the Add Term
 icon again.
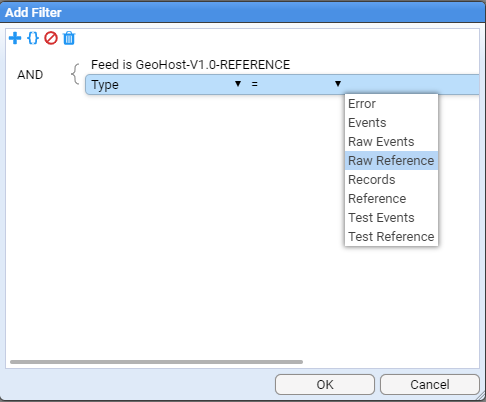
Click on the down arrow to change the Term selection from Feed to Type.
Click in the Value position on the highlighted line (it will be currently empty).
Once you have clicked here a drop-down box will appear as per
at which point, select the Stream Type of Raw Events and then press OK.
At this we return to the Add Processor selection window to see that the Raw Events stream type has been added.
If the expected feed rate is small, for example, NOT operating system or database access feeds, then you would leave the Processor Priority at the default of 10.
Typically, Apache HTTPD access events are not considered to have an excessive feed rate (by comparison to operating system or database access feeds), so we leave the Priority at 10.
Note the Processor has been added but it is in a disabled state.
We enable both pipeline processor and the processor filter by checking both Enabled check boxes
Once the processor has been enabled, at first you will see nothing.
But if you press the
 button at the top of the right of the top pane, you will see that the Child processor has processed a stream, listing the time it did it and also listing the last time the processor looked for more streams to process and how many it found.
If your event feed contained multiple streams you would see the streams count incrementing and the Tracker% incrementing (when the Tracker% reaches 100% then all current streams you filtered for have been processed).
You may need to click on the refresh
 icon to see the stream count and Tracker% changes.
When in the Processors sub-item, if we select the Parent Processor, then no meta-data is displayed
If we select the Parent’s child, then we see the meta-data for this, the actual actionable Processor
If you select the Active Tasks sub-item, you will see a summary of the recently processed streams
The top pane provides a summary table of recent stream batches processed, based on Pipeline and Feed, and if selected, the individual streams will be displayed in the bottom pane
If further detail is required, then left click on the
 icon at the top left of a pane.
This will reveal additional information such as
At this point, if you click on the Data sub-item you will see
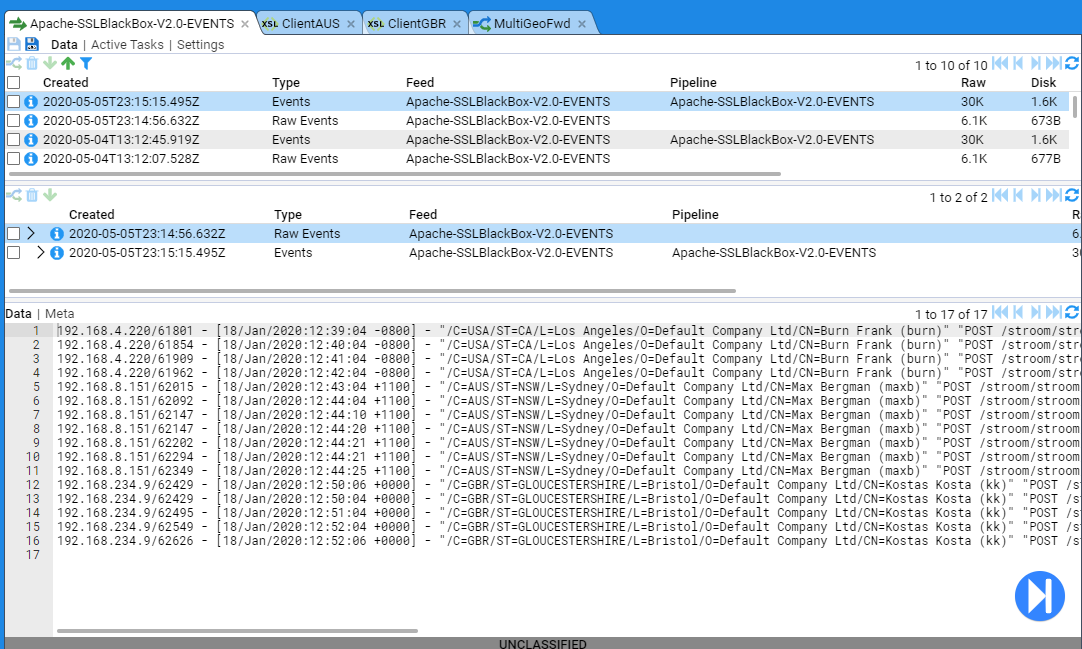
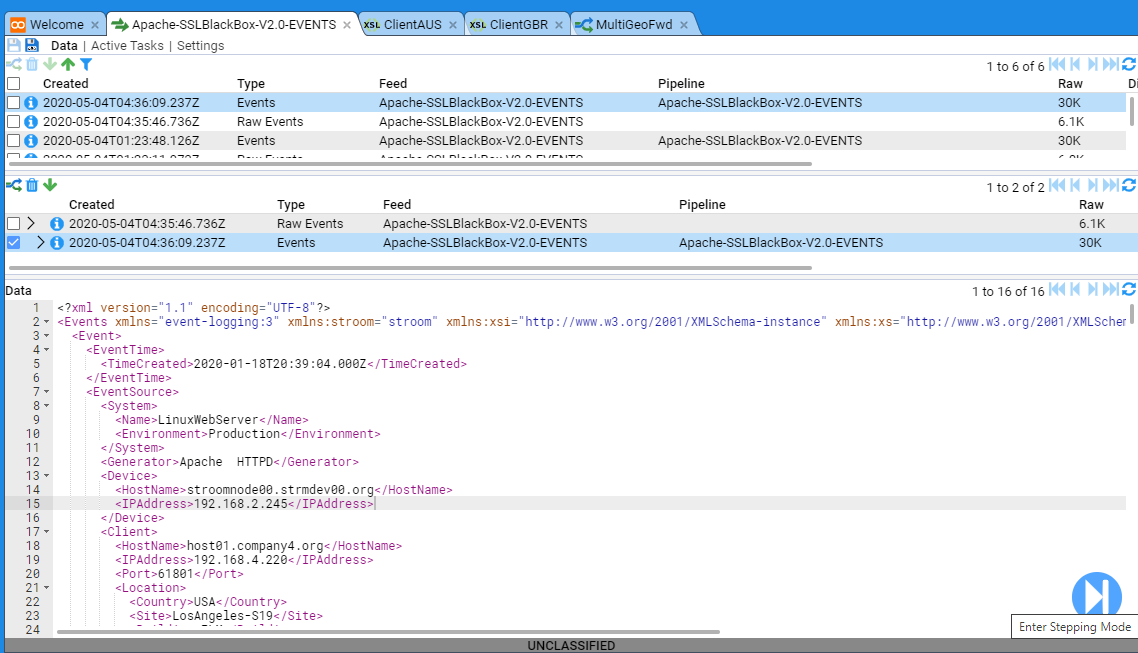
This view displays the recently processed streams in the top pane.
If a stream is selected, then the Specific stream and any related streams are displayed in the middle pane and the bottom pane displays the data itself
As you can see, the processed stream has an associated Raw Events stream.
If we click on that stream we will see the raw data
Processor Errors
Occasionally you may need to reprocess a stream.
This is most likely required as a result of correcting translation issues during the development phase, or it can occur from the data source having an unexpected change (unnotified application upgrade for example).
You can reprocess a stream by selecting its check box and then pressing the
 icon in the top left of the same pane.
This will cause the pipeline to reprocess the selected stream.
One can only reprocess Event or Error streams.
In the below example we have a stream that is displaying errors (this was due to a translation that did not conform to the schema version).
Once the translation was remediated to remove schema issues the pipeline could successfully process the stream and the errors disappeared.
You should be aware that if you need to reprocess bulk streams that there is an upper limit of 1000 streams that can be reprocessed in a single batch.
As at Stroom v6 if you exceed this number then you receive no error notification but the task never completes.
The reason for this behaviour is to do with database performance and complexity.
When you reprocess the current selection of filtered data, it can contain data that has resulted from many pipelines and this requires creation of new processor filters for each of these pipelines.
Due to this complexity there exists an arbitrary limit of 1000 streams.
A workaround for this limitation is to create batches of ‘Events’ by filtering the event streams based on Type and Create Time.
For example in our Apache-SSLBlackBox-V2.0-EVENTS event feed select the
 icon.
icon.
Filter the feed by errors and creation time.
Then click OK.
You will need to adjust the create time range until you get the number of event streams displayed in the feed window below 1000.
Once you are displaying less than 1000 streams you can select all the streams in your filtered selection by clicking in the topmost check box.
Then click on the
 icon to reprocess these streams.
Repeat the process in batches of less that 1000 until your entire error stream backlog has been reprocessed.
In a worst case senario, one can also delete a set of streams for a given time period and then reprocess them all.
The only risk here is that if there
are other pipelines that trigger on Event creation, you will activate them.
The reprocessing may result in having two index entries in an index.
Stroom dashboards can silently cater for this, or you may chose to re-flatten data to some external downstream capability.
When considering reprocessing streams there are some other ‘downstream effects’ to be mindful of.
If you have indexing in place, then additional index documents will be added to the index as the indexing capability does not replace documents, but adds them.
If there are only a small number of streams reprocessed then there should not be too big an index storage impost, but should a large number of streams be reprocessed, then consideration of rebuilding resultant indices may need to be considered.
If the pipeline exports data for consumption by another capability, then you will have exported a portion of the data twice.
Depending on the risk of downstream data duplication, you may need to prevent the export or the consumption of the export.
Some ways to address this can vary from creating a new pipeline to reprocess the errant streams which does not export data, to temporarily redirecting the export destination whilst reprocessing and preventing ingest of new source data to the pipeline at the same time.
1.2 - Explorer Management
How to manage Documents and Entities in the Explorer Tree.
Moving a set of Objects
The following shows how to create a System Folder(s) within the Explorer tree and move a set of objects into the new structure.
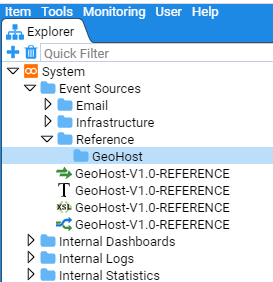
We will create the system group GeoHost Reference and move all the GeoHost reference feed objects into this system group.
Because Stroom Explorer is a flat structure you can move resources around to reorganise the content without any impact on directory paths, configurations etc.
Create a System Group
First, move your mouse over the Event Sources object in the explorer, single click to highlight this object to highlight, you will see
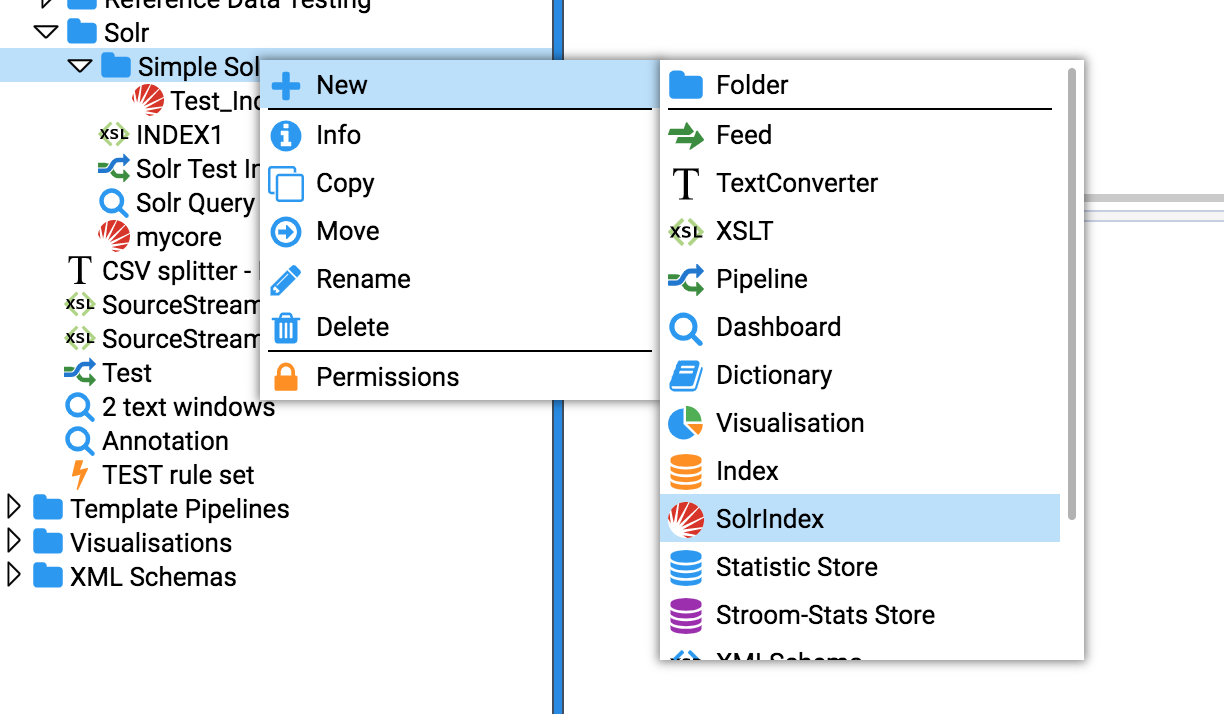
Now right click to bring up the object context menu
Next move the mouse over the
 New icon to reveal the New sub-context menu.
Click on the folder
 icon, at which point the New Folder selection window will be presented
We will enter the name Reference into the Name: entry box
With the newly created Reference folder highlighted, repeat the above process but use the folder Name: of GeoHost
then click
Ok
to save.
Note that we could have navigated within the explorer tree but as we want the Reference/GeoHost system group at the top level of the Event Sources group, there is no need to perform any navigation.
Had we needed to, double click any system group that contains objects, indicated by the icon and to select the system group you want to store your new group in, just left or right click the mouse once over the group to select it.
You will note that the Event Sources system group was selected above.
At this point, our new folders will display in the main pane.
You can look at the folder properties by selecting the desired folder, right clicking and choosing Info option
This will return a window with folder specific information
Should you wish to limit the users who can access this folder, you similarly select the desired folder, right click and choose Permissions
You can limit folder access as required in the resultant window.
Make any required changes and click on
Ok
to save the changes.
Moving Objects into a System Group
Now you have created the new folder structure you can move the various GeoHost resources to this location.
Select all four resources by using the mouse right-click button while holding down the Shift key.
Then right click on the highlighted group to display the action menu
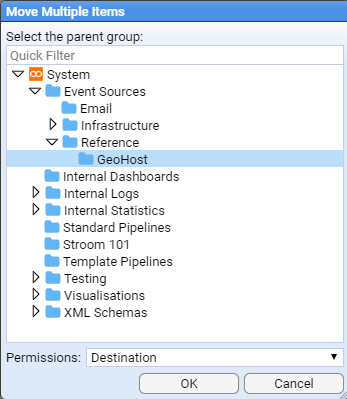
Select move
 and the Move Multiple Items window will display.
Navigate to the
 Reference/GeoHost folder to move the items to this destination.
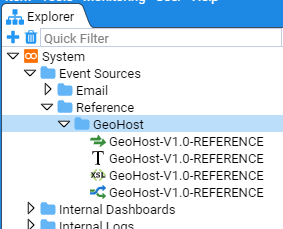
The final structure is seen below
Note that when a folder contains child objects this is indicated by a folder icon with an arrow to the left of the folder.
Whether the arrow is pointing right
 or down
 indicates whether or not the folder is expanded.
The GeoHost resources move has now been completed.
1.3 - Feed Management
This HOWTO demonstrates how to manage feeds.
This HOWTO demonstrates how to manage
Feeds
Assumptions
- All Sections
- an account with the
Administrator Application Permission is currently logged in.
Creation of an Event Feed
We will be creating an Event Feed with the name TEST-FEED-V1_0.
Once you have logged in, move the cursor to the System folder within the Explorer tab and select it.
Once selected, right click to bring up the New Item selection sub-menu. By selecting the System folder we are
requesting any new item created to be placed within it.
Select
 New =>
 Feed.
Feed.
You will be presented with a New Feed configuration window.
You will note that the System folder has already been selected as the parent group and all we need to do is enter our feed’s name in the Name: entry box
On pressing
Ok
we are presented with the Feed tab for our new feed. The tab is labelled with the feed name TEST-FEED-V1_0.
We will leave the definitions of the Feed attributes for the present, but we will enter a Description: for our feed
as we should ALWAYS do this fundamental tenet of data management - document the data. We will use
the description of ‘Feed for installation validation only. No data value’.
One should note that the
 * TEST-FEED-V1_0
×
tab has been marked as having unsaved changes.
This is indicated by the asterisk character
 * between the Feed icon
 and the name of the feed
 TEST-FEED-V1_0.
We can save the changes to our feed by pressing the Save icon
 in the top left of the
 TEST-FEED-V1_0 tab. At this point one should notice two things, the first is that the asterisk
has disappeared from the Feed tab and the Save icon
 is ghosted.
Folder Structure for Event Sources
In order to simplify the management of multiple event sources being processed by Stroom, it is suggested that an Event Source folder is created at the root of the System folder
 in the
 Explorer tab.
This can be achieved by right clicking on the
 System root folder and selecting
 New =>
 Folder
You will be presented with a New Folder configuration window.
You will note that the System folder has already been selected as the parent group and all we need to do is enter our folders’s name in the Name: entry box
On pressing
Ok
we are presented with the
 Event Sources
×
tab for our new folder.
You will also note that the Explorer tab has displayed the Event Sources folder in its display.
Create Folder for specific Event Source
In order to manage all artefacts of a given Event Source (aka Feed), one would create an appropriately named sub-folder within the Event Sources folder structure.
In this example, we will create one for a BlueCoat Proxy Feed.
As we may eventually have multiple proxy event sources, we will first create a Proxy folder in the Event Sources before creating the desired BlueCoat folder that will hold the processing components.
So, right-click on the
 Event Sources folder in the Explorer tree and select:
 New =>
 Folder
You will be presented with a New Folder configuration window.
Enter Proxy as the folder Name:
and press
Ok
.
At this you will be presented with a new
 Proxy
×
tab for the new sub-folder and we note that it has been added below the Event Sources folder in the Explorer tree.
Repeat this process to create the desired BlueCoat sub-folder with the result
.
1.4 - Raw Source Tracking
How to link every Event back to the Raw log
Stroom v6.1 introduced a new feature (stroom:source()) to allow a translation developer to obtain positional details of the source file that is currently being processed.
Using the positional information it is possible to tag Events with sufficient details to link back to the Raw source.
Assumptions
- You have a working pipeline that processes logs into Events.
- Events are indexed
- You have a Dashboard uses a Search Extraction pipeline.
Steps
-
Create a new XSLT called Source Decoration containing the following:
<xsl:stylesheet
    xpath-default-namespace="event-logging:3"
    xmlns:sm="stroom-meta" xmlns="event-logging:3"
    xmlns:rec="records:2"
    xmlns:stroom="stroom"
    version="3.0"
    xmlns:xsl="http://www.w3.org/1999/XSL/Transform">
  <xsl:template match="@*|node()">
    <xsl:copy>
      <xsl:apply-templates select="@*|node()" />
    </xsl:copy>
  </xsl:template>
  <xsl:template match="Event/Meta[not(sm:source)]">
    <xsl:copy>
      <xsl:apply-templates />
      <xsl:copy-of select="stroom:source()" />
    </xsl:copy>
  </xsl:template>
  <xsl:template match="Event[not(Meta)]">
    <xsl:copy>
      <xsl:element name="Meta">
        <xsl:copy-of select="stroom:source()" />
      </xsl:element>
      <xsl:apply-templates />
    </xsl:copy>
  </xsl:template>
</xsl:stylesheet>
This XSLT will add or augment the Meta section of the Event with the source details.
-
Insert a new XSLT filter into your translation pipeline after your translation filter and set it to the XSLT created above.
-
Reprocess the Events through the modified pipeline, also ensure your Events are indexed.
-
Amend the translation performed by the Extraction pipeline to include the new data items that represent the source position data. Add the following to the XSLT:
<xsl:element name="data">
  <xsl:attribute name="name">
    <xsl:text>src-id</xsl:text>
  </xsl:attribute>
  <xsl:attribute name="value" select="Meta/sm:source/sm:id" />
</xsl:element>
<xsl:element name="data">
  <xsl:attribute name="name">
    <xsl:text>src-partNo</xsl:text>
  </xsl:attribute>
  <xsl:attribute name="value" select="Meta/sm:source/sm:partNo" />
</xsl:element>
<xsl:element name="data">
  <xsl:attribute name="name">
    <xsl:text>src-recordNo</xsl:text>
  </xsl:attribute>
  <xsl:attribute name="value" select="Meta/sm:source/sm:recordNo" />
</xsl:element>
<xsl:element name="data">
  <xsl:attribute name="name">
    <xsl:text>src-lineFrom</xsl:text>
  </xsl:attribute>
  <xsl:attribute name="value" select="Meta/sm:source/sm:lineFrom" />
</xsl:element>
<xsl:element name="data">
  <xsl:attribute name="name">
    <xsl:text>src-colFrom</xsl:text>
  </xsl:attribute>
  <xsl:attribute name="value" select="Meta/sm:source/sm:colFrom" />
</xsl:element>
<xsl:element name="data">
  <xsl:attribute name="name">
    <xsl:text>src-lineTo</xsl:text>
  </xsl:attribute>
  <xsl:attribute name="value" select="Meta/sm:source/sm:lineTo" />
</xsl:element>
<xsl:element name="data">
  <xsl:attribute name="name">
    <xsl:text>src-colTo</xsl:text>
  </xsl:attribute>
  <xsl:attribute name="value" select="Meta/sm:source/sm:colTo" />
</xsl:element>
-
Open your dashboard, now add the following custom fields to your table:
${src-id}, ${src-partNo}, ${src-recordNo}, ${src-lineFrom}, ${src-lineTo}, ${src-colFrom}, ${src-colTo}
-
Now add a New Text Window to your Dashboard, and configure it as below:
-
You can also add a column to the table that will open a data window showing the source.
Add a custom column with the following expression:
data('Raw Log',${src-id},${src-partNo},'',${src-lineFrom},${src-colFrom},${src-lineTo},${src-colTo})
1.5 - Task Management
This HOWTO demonstrates how to manage background tasks.
Various
Tasks
run in the background within Stroom. This HOWTO demonstrates how to manage these tasks
Assumptions
- All Sections
- an account with the
Administrator Application Permission is currently logged in.
- Proxy Aggregation Tasks
- we have a multi node Stroom cluster with two nodes,
stroomp00 and stroomp01.
- Stream Processor Tasks
- we have a multi node Stroom cluster with two nodes,
stroomp00 and stroomp01.
- when demonstrating adding a new node to an existing cluster, the new node is
stroomp02.
Proxy Aggregation
Turn Off Proxy Aggregation
We first select the Monitoring item of the Main Menu to bring up the Monitoring sub-menu.
then move down and select the Jobs sub-item to be presented with the Jobs configuration tab as seen below.
At this we can select the Proxy Aggregation Job whose check-box is selected and the tab will show the individual Stroom Processor nodes
in the deployment.
At this, uncheck the Enabled check-boxes for both nodes and also the main Proxy Aggregation check-box to see.
At this point, no new proxy aggregation will occur and any inbound files received by the Store Proxies will accumulate in the proxy storage area.
Turn On Proxy Aggregation
We first select the Monitoring item of the Main Menu to bring up the Monitoring sub-menu.
then move down and select the Jobs sub-item then select the Proxy Aggregation Job to be presented with the Jobs configuration tab as seen below.
Now, re-enable each node’s Proxy Aggregation check-box and the main Proxy Aggregation check-box.
After checking the check-boxes, perform a refresh of the display by pressing the Refresh icon
 .
.
on the top right of the lower (node display) pane. You should note the Last Executed date/time change to see
Stream Processors
Enable Stream Processors
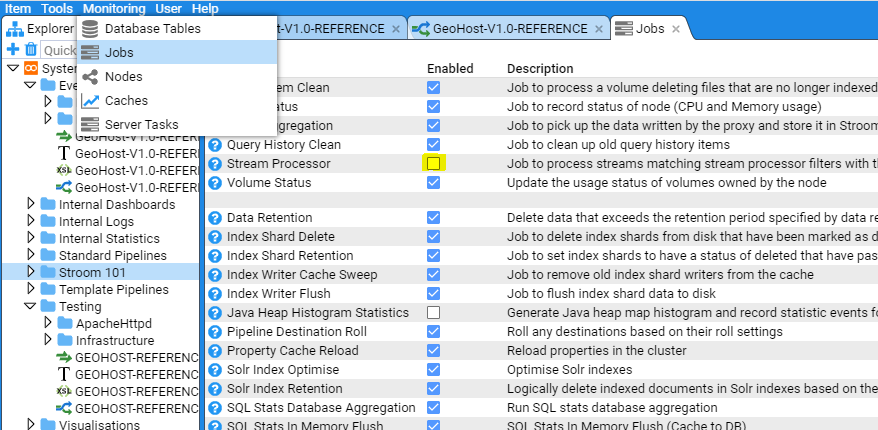
To enable the Stream Processors task, move to the Monitoring item of the Main Menu and select it to bring up the Monitoring sub-menu.
then move down and select the Jobs sub-item to be presented with the Jobs configuration tab as seen below.
At this, we select the Stream Processor Job whose check-box is not selected and the tab will show the individual Stroom Processor
nodes in the Stroom deployment.
Clearly, if it was a single node Stroom deployment, you would only see the one node at the bottom of the Jobs configuration tab.
We enable nodes nodes by selecting their check-boxes as well as the main Stream Processors check-box. Do so.
That is it. Stroom will automatically take note of these changes and internally start each node’s Stroom Processor task.
Enable Stream Processors On New Node
When one expands a Multi Node Stroom cluster deployment, after the installation of the Stroom Proxy and Application software and
services on the new node, we need to enable it’s Stream Processors task.
To enable the Stream Processors for this new node, move to the Monitoring item of the Main Menu and select it to bring up the Monitoring sub-menu.
then move down and select the Jobs sub-item to be presented with the Jobs configuration tab as seen below.
At this we select the Stream Processor Job whose check-box is selected
We enable the new node by selecting it’s check-box.
2 - Administration
2.1 - System Properties
This HOWTO is provided to assist users in managing Stroom System Properties via the User Interface.
Assumptions
The following assumptions are used in this document.
- the user successfully logged into Stroom with the appropriate administrative privilege (Manage Properties).
Introduction
Certain Stroom System Properties can be edited via the Stroom User Interface.
Editing a System Property
To edit a System Property select the Tools item of the Main Menu and select to bring up the Tools sub-menu.
Then move down and select the Properties sub-item to be presented with System Properties configuration window as seen below.
Using the Scrollbar to the right of the System Properties configuration window and scroll down to the line where the property one wants to modify is displayed then select (left click) the line.
In the example below we have selected the stroom.maxStreamSize property.
Now bring up the editing window by double clicking on the selected line.
At this we will be presented with the
Application Property - stroom.maxStreamSize editing window.
Now edit the property, by double clicking the string in the Value entry box.
In this case we select the 1G value to see
Now change the selected 1G value to the value we want.
In this example, we are changing the value to 512M.
At this, press the
Ok
to see the new value updated in the System Properties configuration window
3 - Authentication
3.1 - Create a user
This HOWTO provides the steps to create a user via the Stroom User Interface.
Assumptions
The following assumptions are used in this document.
- An account with the
Administrator Application Permission is currently logged in.
- We will be adding the user
burn
- We will make this user an
Administrator
Add a new user
To add a new user, move your cursor to the Tools item of the Main Menu and select to bring up the Tools sub-menu.
then move down and select the Users and Groups sub-item to be presented with the Users and Groups configuration window as seen below.
To add the user, move the cursor to the New icon
 in the top left and
select it. On selection you will be prompted for a user name. In our case we will enter the user
 burn.
and on pressing
Ok
will be presented with the User configuration window.
Set the User Application Permissions
See
Permissions
for an explanation of the various Application Permissions a user can have.
Assign an Administrator Permission
As we want the user to be an administrator, select the Administrator Permission check-box
Set User’s Password
We need to set burn's password (which he will need to reset on first login). So, select the
Reset Password
button to gain the Reset Password window
After setting a password and pressing the
Ok
button we get the informational Alert window as per
and on close of the Alert we are presented again with the User configuration window.
We should close this window by pressing the
Close
button to be presented with the Users and Groups window with the new user burn added.
At this, one can close the Users and Groups configuration window by pressing the
Close
button at the bottom right of the window.
3.2 - Login
This HOWTO shows how to log into the Stroom User Interface.
Assumptions
The following assumptions are used in this document.
- for manual login, we will log in as the user
admin whose password is set to admin and the password is pre-expired
- for PKI Certificate login, the Stroom deployment would have been configured to accept PKI Logins
Manual Login
Within the Login panel, enter admin into the User Name: entry box and admin into the Password: entry box as per
When you press the
Login
button, you are advised that your user’s password has expired and you need to change it.
Press the
Ok
button and enter the old password admin and a new password with confirmation in the appropriate entry boxes.
Again press the
Ok
button to see the confirmation that the password has changed.
.
On pressing
Close
you will be logged in as the admin user and you will be presented with the Main Menu (Item Tools Monitoring User Help), and the Explorer and Welcome panels (or tabs).
We have now successfully logged on as the admin user.
The next time you login with this account, you will not be prompted to change the password until the password expiry period has been met.
PKI Certificate Login
To login using a PKI Certificate, a user should have their Personal PKI certificate loaded in the browser (and selected if
you have multiple certificates) and the user just needs to go to the Stroom UI URL, and providing you have an account, you will be
automatically logged in.
3.3 - Logout
This HOWTO shows how to log out of the Stroom User Interface.
Assumptions
The following assumptions are used in this document.
- the user
admin is currently logged in
Log out of UI
To log out of the UI, select the User item of the Main Menu and to bring up the User sub-menu.
and select the Logout sub-item and confirm you wish to log out by selecting the
Ok
button.
This will return you to the Login page
4 - Installation
Various How Tos convering installation of Stroom and its dependencies
4.1 - Apache Httpd/Mod_JK configuration for Stroom
The following is a HOWTO to assist users in configuring Apache’s HTTPD with Mod_JK for Stroom.
Assumptions
The following assumptions are used in this document.
- the user has reasonable RHEL/Centos System administration skills
- installations are on Centos 7.3 minimal systems (fully patched)
- the security of the HTTPD deployment should be reviewed for a production environment.
Installation of Apache httpd and Mod_JK Software
To deploy Stroom using Apache’s httpd web service as a front end (https) and Apache’s mod_jk as the interface between Apache and the Stroom tomcat applications, we also need
- apr
- apr-util
- apr-devel
- gcc
- httpd
- httpd-devel
- mod_ssl
- epel-release
- tomcat-native
- apache’s mod_jk tomcat connector plugin
Most of the required software are packages available via standard repositories and hence we can simply execute
sudo yum -y install apr apr-util apr-devel gcc httpd httpd-devel mod_ssl epel-release
sudo yum -y install tomcat-native
The reason for the distinct tomcat-native installation is that this package is from the EPEL (external link) repository so it must be installed first.
For the Apache mod_jk Tomcat connector we need to acquire a recent
release (external link) and install it.
The following commands achieve this for the 1.2.42 release.
sudo bash
cd /tmp
V=1.2.42
wget https://www.apache.org/dist/tomcat/tomcat-connectors/jk/tomcat-connectors-${V}-src.tar.gz
tar xf tomcat-connectors-${V}-src.tar.gz
cd tomcat-connectors-*-src/native
./configure --with-apxs=/bin/apxs
make && make install
cd /tmp
rm -rf tomcat-connectors-*-src
Although you could remove the gcc compiler at this point, we leave it installed as one should continue to upgrade the Tomcat Connectors to later releases.
We need to configure Apache as the root user.
If the Apache httpd service is ‘fronting’ a Stroom user interface, we should create an index file (/var/www/html/index.html) on all nodes so browsing to
the root of the node will present the Stroom UI. This is not needed if you are deploying a Forwarding or Standalone Stroom proxy.
Forwarding file for Stroom User Interface deployments
F=/var/www/html/index.html
printf '<html>\n' > ${F}
printf '<head>\n' >> ${F}
printf '  <meta http-equiv="Refresh" content="0; URL=stroom"/>\n' >> ${F}
printf '</head>\n' >> ${F}
printf '</html>\n' >> ${F}
chmod 644 ${F}
Remember, deploy this file on all nodes running the Stroom Application.
Httpd.conf Configuration
We modify /etc/httpd/conf/httpd.conf on all nodes, but backup the file first with
cp /etc/httpd/conf/httpd.conf /etc/httpd/conf/httpd.conf.ORIG
Irrespective of the Stroom scenario being deployed - Multi Node Stroom (Application and Proxy), single Standalone Stroom Proxy or single Forwarding
Stroom Proxy, the configuration of the /etc/httpd/conf/httpd.conf file is the same.
We start by modify the configuration file by,
add just before the ServerRoot directive the following directives which are designed to make the httpd service more secure.
# Stroom Change: Start - Apply generic security directives
ServerTokens Prod
ServerSignature Off
FileETag None
RewriteEngine On
RewriteCond %{THE_REQUEST} !HTTP/1.1$
RewriteRule .* - [F]
Header set X-XSS-Protection "1; mode=block"
# Stroom Change: End
That is,
...
# Do not add a slash at the end of the directory path.  If you point
# ServerRoot at a non-local disk, be sure to specify a local disk on the
# Mutex directive, if file-based mutexes are used.  If you wish to share the
# same ServerRoot for multiple httpd daemons, you will need to change at
# least PidFile.
#
ServerRoot "/etc/httpd"

#
# Listen: Allows you to bind Apache to specific IP addresses and/or
...
becomes
...
# Do not add a slash at the end of the directory path.  If you point
# ServerRoot at a non-local disk, be sure to specify a local disk on the
# Mutex directive, if file-based mutexes are used.  If you wish to share the
# same ServerRoot for multiple httpd daemons, you will need to change at
# least PidFile.
#
# Stroom Change: Start - Apply generic security directives
ServerTokens Prod
ServerSignature Off
FileETag None
RewriteEngine On
RewriteCond %{THE_REQUEST} !HTTP/1.1$
RewriteRule .* - [F]
Header set X-XSS-Protection "1; mode=block"
# Stroom Change: End
ServerRoot "/etc/httpd"

#
# Listen: Allows you to bind Apache to specific IP addresses and/or
...
We now block access to the /var/www directory by commenting out
<Directory "/var/www">
  AllowOverride None
  # Allow open access:
  Require all granted
</Directory>
that is
...
#
# Relax access to content within /var/www.
#
<Directory "/var/www">
    AllowOverride None
    # Allow open access:
    Require all granted
</Directory>

# Further relax access to the default document root:
...
becomes
...
#
# Relax access to content within /var/www.
#
# Stroom Change: Start - Block access to /var/www
# <Directory "/var/www">
#     AllowOverride None
#     # Allow open access:
#     Require all granted
# </Directory>
# Stroom Change: End

# Further relax access to the default document root:
...
then within the /var/www/html directory turn off Indexes FollowSymLinks by commenting out the line
Options Indexes FollowSymLinks
That is
...
    # The Options directive is both complicated and important.  Please see
    # http://httpd.apache.org/docs/2.4/mod/core.html#options
    # for more information.
    #
    Options Indexes FollowSymLinks

    #
    # AllowOverride controls what directives may be placed in .htaccess files.
    # It can be "All", "None", or any combination of the keywords:
...
becomes
...
    # The Options directive is both complicated and important.  Please see
    # http://httpd.apache.org/docs/2.4/mod/core.html#options
    # for more information.
    #
    # Stroom Change: Start - turn off indexes and FollowSymLinks
    # Options Indexes FollowSymLinks
    # Stroom Change: End

    #
    # AllowOverride controls what directives may be placed in .htaccess files.
    # It can be "All", "None", or any combination of the keywords:
...
Then finally we add two new log formats and configure the access log to use the new format. This is done within the <IfModule logio_module> by adding the two new LogFormat directives
LogFormat "%a/%{REMOTE_PORT}e %X %t %l \"%u\" \"%r\" %s/%>s %D %I/%O/%B \"%{Referer}i\" \"%{User-Agent}i\" %V/%p" blackboxUser
LogFormat "%a/%{REMOTE_PORT}e %X %t %l \"%{SSL_CLIENT_S_DN}x\" \"%r\" %s/%>s %D %I/%O/%B \"%{Referer}i\" \"%{User-Agent}i\" %V/%p" blackboxSSLUser
and replacing the CustomLog directive
CustomLog "logs/access_log" combined
with
CustomLog logs/access_log blackboxSSLUser
That is
...
    LogFormat "%h %l %u %t \"%r\" %>s %b" common

    <IfModule logio_module>
      # You need to enable mod_logio.c to use %I and %O
      LogFormat "%h %l %u %t \"%r\" %>s %b \"%{Referer}i\" \"%{User-Agent}i\" %I %O" combinedio
    </IfModule>

    #
    # The location and format of the access logfile (Common Logfile Format).
    # If you do not define any access logfiles within a <VirtualHost>
    # container, they will be logged here.  Contrariwise, if you *do*
    # define per-<VirtualHost> access logfiles, transactions will be
    # logged therein and *not* in this file.
    #
    #CustomLog "logs/access_log" common

    #
    # If you prefer a logfile with access, agent, and referer information
    # (Combined Logfile Format) you can use the following directive.
    #
    CustomLog "logs/access_log" combined
</IfModule>
...
becomes
...
    LogFormat "%h %l %u %t \"%r\" %>s %b" common

    <IfModule logio_module>
      # You need to enable mod_logio.c to use %I and %O
      LogFormat "%h %l %u %t \"%r\" %>s %b \"%{Referer}i\" \"%{User-Agent}i\" %I %O" combinedio
      # Stroom Change: Start - Add new logformats
      LogFormat "%a/%{REMOTE_PORT}e %X %t %l \"%u\" \"%r\" %s/%>s %D %I/%O/%B \"%{Referer}i\" \"%{User-Agent}i\" %V/%p" blackboxUser
      LogFormat "%a/%{REMOTE_PORT}e %X %t %l \"%{SSL_CLIENT_S_DN}x\" \"%r\" %s/%>s %D %I/%O/%B \"%{Referer}i\" \"%{User-Agent}i\" %V/%p" blackboxSSLUser
      # Stroom Change: End
    </IfModule>
    # Stroom Change: Start - Add new logformats without the additional byte values
    <IfModule !logio_module>
      LogFormat "%a/%{REMOTE_PORT}e %X %t %l \"%u\" \"%r\" %s/%>s %D 0/0/%B \"%{Referer}i\" \"%{User-Agent}i\" %V/%p" blackboxUser
      LogFormat "%a/%{REMOTE_PORT}e %X %t %l \"%{SSL_CLIENT_S_DN}x\" \"%r\" %s/%>s %D 0/0/%B \"%{Referer}i\" \"%{User-Agent}i\" %V/%p" blackboxSSLUser
    </IfModule>
    # Stroom Change: End

    #
    # The location and format of the access logfile (Common Logfile Format).
    # If you do not define any access logfiles within a <VirtualHost>
    # container, they will be logged here.  Contrariwise, if you *do*
    # define per-<VirtualHost> access logfiles, transactions will be
    # logged therein and *not* in this file.
    #
    #CustomLog "logs/access_log" common

    #
    # If you prefer a logfile with access, agent, and referer information
    # (Combined Logfile Format) you can use the following directive.
    #
    # Stroom Change: Start - Make the access log use a new format
    # CustomLog "logs/access_log" combined
    CustomLog logs/access_log blackboxSSLUser
    # Stroom Change: End
</IfModule>
...
Remember, deploy this file on all nodes.
Configuration of ssl.conf
We modify /etc/httpd/conf.d/ssl.conf on all nodes, backing up first,
cp /etc/httpd/conf.d/ssl.conf /etc/httpd/conf.d/ssl.conf.ORIG
The configuration of the /etc/httpd/conf.d/ssl.conf does change depending on the Stroom scenario deployed. In the following we will indicate
differences by tagged sub-headings. If the configuration applies irrespective of scenario, then All scenarios is the tag, else the tag indicated the
type of Stroom deployment.
ssl.conf: HTTP to HTTPS Redirection - All scenarios
Before the context we add http to https redirection by adding the directives (noting we specify the actual server name)
<VirtualHost *:80>
  ServerName stroomp00.strmdev00.org
  Redirect permanent "/" "https://stroomp00.strmdev00.org/"
</VirtualHost>
That is, we change
...
## SSL Virtual Host Context
##

<VirtualHost _default_:443>
...
to
...
## SSL Virtual Host Context
##

# Stroom Change: Start - Add http redirection to https
<VirtualHost *:80>
  ServerName stroomp00.strmdev00.org
  Redirect permanent "/" "https://stroomp00.strmdev00.org/"
</VirtualHost>
# Stroom Change: End

<VirtualHost _default_:443>
ssl.conf: VirtualHost directives - Multi Node ‘Application and Proxy’ deployment
Within the context we set the directives, in this case, we use the CNAME stroomp.strmdev00.org
ServerName stroomp.strmdev00.org
JkMount /stroom* loadbalancer
JkMount /stroom/remoting/cluster* local
JkMount /stroom/datafeed* loadbalancer_proxy
JkMount /stroom/remoting* loadbalancer_proxy
JkMount /stroom/datafeed/direct* loadbalancer
JkOptions +ForwardKeySize +ForwardURICompat +ForwardSSLCertChain -ForwardDirectories
That is, we change
...
<VirtualHost _default_:443>

# General setup for the virtual host, inherited from global configuration
#DocumentRoot "/var/www/html"
#ServerName www.example.com:443

# Use separate log files for the SSL virtual host; note that LogLevel
# is not inherited from httpd.conf.
...
to
...
<VirtualHost _default_:443>

# General setup for the virtual host, inherited from global configuration
#DocumentRoot "/var/www/html"
#ServerName www.example.com:443
# Stroom Change: Start - Set servername and mod_jk connectivity
ServerName stroomp.strmdev00.org
JkMount /stroom* loadbalancer
JkMount /stroom/remoting/cluster* local
JkMount /stroom/datafeed* loadbalancer_proxy
JkMount /stroom/remoting* loadbalancer_proxy
JkMount /stroom/datafeed/direct* loadbalancer
JkOptions +ForwardKeySize +ForwardURICompat +ForwardSSLCertChain -ForwardDirectories
# Stroom Change: End

# Use separate log files for the SSL virtual host; note that LogLevel
# is not inherited from httpd.conf.
...
ssl.conf: VirtualHost directives - Standalone or Forwarding Proxy deployment
Within the context set the directives, in this case, for a node named say stroomfp0.strmdev00.org
ServerName stroomfp0.strmdev00.org
JkMount /stroom/datafeed* local_proxy
JkOptions +ForwardKeySize +ForwardURICompat +ForwardSSLCertChain -ForwardDirectories
That is, we change
...
<VirtualHost _default_:443>

# General setup for the virtual host, inherited from global configuration
#DocumentRoot "/var/www/html"
#ServerName www.example.com:443

# Use separate log files for the SSL virtual host; note that LogLevel
# is not inherited from httpd.conf.
...
to
...
<VirtualHost _default_:443>

# General setup for the virtual host, inherited from global configuration
#DocumentRoot "/var/www/html"
#ServerName www.example.com:443
# Stroom Change: Start - Set servername and mod_jk connectivity
ServerName stroomfp0.strmdev00.org
JkMount /stroom/datafeed* local_proxy
JkOptions +ForwardKeySize +ForwardURICompat +ForwardSSLCertChain -ForwardDirectories
# Stroom Change: End

# Use separate log files for the SSL virtual host; note that LogLevel
# is not inherited from httpd.conf.
...
ssl.conf: VirtualHost directives - Single Node ‘Application and Proxy’ deployment
Within the context set the directives, in this case, for a node name stroomp00.strmdev00.org
ServerName stroomp00.strmdev00.org
JkMount /stroom* local
JkMount /stroom/remoting/cluster* local
JkMount /stroom/datafeed* local_proxy
JkMount /stroom/remoting* local_proxy
JkMount /stroom/datafeed/direct* local
JkOptions +ForwardKeySize +ForwardURICompat +ForwardSSLCertChain -ForwardDirectories
That is, we change
...
<VirtualHost _default_:443>

# General setup for the virtual host, inherited from global configuration
#DocumentRoot "/var/www/html"
#ServerName www.example.com:443

# Use separate log files for the SSL virtual host; note that LogLevel
# is not inherited from httpd.conf.
...
to
...
<VirtualHost _default_:443>

# General setup for the virtual host, inherited from global configuration
#DocumentRoot "/var/www/html"
#ServerName www.example.com:443
# Stroom Change: Start - Set servername and mod_jk connectivity
ServerName stroomp00.strmdev00.org
JkMount /stroom* local
JkMount /stroom/remoting/cluster* local
JkMount /stroom/datafeed* local_proxy
JkMount /stroom/remoting* local_proxy
JkMount /stroom/datafeed/direct* local
JkOptions +ForwardKeySize +ForwardURICompat +ForwardSSLCertChain -ForwardDirectories
# Stroom Change: End

# Use separate log files for the SSL virtual host; note that LogLevel
# is not inherited from httpd.conf.
...
ssl.conf: Certificate file changes - All scenarios
We replace the standard certificate files with the generated certificates. In the example below, we are using the multi node scenario, in
that the key file names are stroomp.crt and stroomp.key. For other scenarios, use the appropriate file names generated. We replace
SSLCertificateFile /etc/pki/tls/certs/localhost.crt
with
SSLCertificateFile /home/stroomuser/stroom-jks/public/stroomp.crt
and
SSLCertificateKeyFile /etc/pki/tls/private/localhost.key
with
SSLCertificateKeyFile /home/stroomuser/stroom-jks/private/stroomp.key
That is, change
...
# pass phrase.  Note that a kill -HUP will prompt again.  A new
# certificate can be generated using the genkey(1) command.
SSLCertificateFile /etc/pki/tls/certs/localhost.crt

#   Server Private Key:
#   If the key is not combined with the certificate, use this
#   directive to point at the key file.  Keep in mind that if
#   you've both a RSA and a DSA private key you can configure
#   both in parallel (to also allow the use of DSA ciphers, etc.)
SSLCertificateKeyFile /etc/pki/tls/private/localhost.key

#   Server Certificate Chain:
#   Point SSLCertificateChainFile at a file containing the
...
to
...
# pass phrase.  Note that a kill -HUP will prompt again.  A new
# certificate can be generated using the genkey(1) command.
# Stroom Change: Start - Replace with Stroom server certificate
# SSLCertificateFile /etc/pki/tls/certs/localhost.crt
SSLCertificateFile /home/stroomuser/stroom-jks/public/stroomp.crt
# Stroom Change: End

#   Server Private Key:
#   If the key is not combined with the certificate, use this
#   directive to point at the key file.  Keep in mind that if
#   you've both a RSA and a DSA private key you can configure
#   both in parallel (to also allow the use of DSA ciphers, etc.)
# Stroom Change: Start - Replace with Stroom server private key file
# SSLCertificateKeyFile /etc/pki/tls/private/localhost.key
SSLCertificateKeyFile /home/stroomuser/stroom-jks/private/stroomp.key
# Stroom Change: End

#   Server Certificate Chain:
#   Point SSLCertificateChainFile at a file containing the
...
ssl.conf: Certificate Bundle/NO-CA Verification - All scenarios
If you have signed your Stroom server certificate with a Certificate Authority, then change
SSLCACertificateFile /etc/pki/tls/certs/ca-bundle.crt
to be your own certificate bundle which you should probably store as ~stroomuser/stroom-jks/public/stroomp-ca-bundle.crt.
Now if you are using a self signed certificate, you will need to set the Client Authentication to have a value of
SSLVerifyClient optional_no_ca
noting that this may change if you actually use a CA.
That is, changing
...
#   Client Authentication (Type):
#   Client certificate verification type and depth.  Types are
#   none, optional, require and optional_no_ca.  Depth is a
#   number which specifies how deeply to verify the certificate
#   issuer chain before deciding the certificate is not valid.
#SSLVerifyClient require
#SSLVerifyDepth  10

#   Access Control:
#   With SSLRequire you can do per-directory access control based
...
to
...
#   Client Authentication (Type):
#   Client certificate verification type and depth.  Types are
#   none, optional, require and optional_no_ca.  Depth is a
#   number which specifies how deeply to verify the certificate
#   issuer chain before deciding the certificate is not valid.
#SSLVerifyClient require
#SSLVerifyDepth  10
# Stroom Change: Start - Set optional_no_ca (given we have a self signed certificate)
SSLVerifyClient optional_no_ca
# Stroom Change: End

#   Access Control:
#   With SSLRequire you can do per-directory access control based
...
ssl.conf: Servlet Protection - Single or Multi Node scenarios (not for Standalone/Forwarding Proxy)
We now need to secure certain Stroom Application servlets, to ensure they are only accessed under appropriate control.
This set of servlets will be accessible by all nodes in the subnet 192.168.2 (as well as localhost). We achieve this by adding after the example Location directives
<Location ~ "stroom/(status|echo|sessionList|debug)" >
 Require all denied
 Require ip 127.0.0.1 192.168.2
</Location>
We further restrict the clustercall and export servlets to just the localhost. If we had multiple Stroom processing nodes, you would specify each node, or preferably, the subnet they are on. In our multi node case this is 192.168.2.
<Location ~ "stroom/export/|stroom/remoting/clustercall.rpc" >
 Require all denied
 Require ip 127.0.0.1 192.168.2
</Location>
That is, the following
...
#            and %{TIME_WDAY} >= 1 and %{TIME_WDAY} <= 5 \
#            and %{TIME_HOUR} >= 8 and %{TIME_HOUR} <= 20       ) \
#           or %{REMOTE_ADDR} =~ m/^192\.76\.162\.[0-9]+$/
#</Location>

#   SSL Engine Options:
#   Set various options for the SSL engine.
#   o FakeBasicAuth:
...
changes to
...
#            and %{TIME_WDAY} >= 1 and %{TIME_WDAY} <= 5 \
#            and %{TIME_HOUR} >= 8 and %{TIME_HOUR} <= 20       ) \
#           or %{REMOTE_ADDR} =~ m/^192\.76\.162\.[0-9]+$/
#</Location>

# Stroom Change: Start - Lock access to certain servlets
<Location ~ "stroom/(status|echo|sessionList|debug)" >
 Require all denied
 Require ip 127.0.0.1 192.168.2
</Location>
# Lock these Servlets more securely - to just localhost and processing node(s)
<Location ~ "stroom/export/|stroom/remoting/clustercall.rpc" >
 Require all denied
 Require ip 127.0.0.1 192.168.2
</Location>
# Stroom Change: End

#   SSL Engine Options:
#   Set various options for the SSL engine.
#   o FakeBasicAuth:
...
Finally, as we make use of the Black Box Apache log format, we replace the standard format
CustomLog logs/ssl_request_log \
        "%t %h %{SSL_PROTOCOL}x %{SSL_CIPHER}x \"%r\" %b"
with
CustomLog logs/ssl_request_log blackboxSSLUser
That is, change
...
#   Per-Server Logging:
#   The home of a custom SSL log file. Use this when you want a
#   compact non-error SSL logfile on a virtual host basis.
CustomLog logs/ssl_request_log \
          "%t %h %{SSL_PROTOCOL}x %{SSL_CIPHER}x \"%r\" %b"

</VirtualHost>
to
...
#   Per-Server Logging:
#   The home of a custom SSL log file. Use this when you want a
#   compact non-error SSL logfile on a virtual host basis.
# Stroom Change: Start - Change ssl_request log to use our BlackBox format
# CustomLog logs/ssl_request_log \
#           "%t %h %{SSL_PROTOCOL}x %{SSL_CIPHER}x \"%r\" %b"
CustomLog logs/ssl_request_log blackboxSSLUser
# Stroom Change: End

</VirtualHost>
Remember, in the case of Multi node stroom Application servers, deploy this file on all servers.
Apache Mod_JK configuration
Apache Mod_JK has two configuration files
- /etc/httpd/conf.d/mod_jk.conf - for the http server configuration
- /etc/httpd/conf/workers.properties - to configure the Tomcat workers
In multi node scenarios, /etc/httpd/conf.d/mod_jk.conf is the same on all servers, but the /etc/httpd/conf/workers.properties file is different.
The contents of these two configuration files differ depending on the Stroom deployment. The following provide the various deployment scenarios.
Mod_JK Multi Node Application and Proxy Deployment
For a Stroom Multi node Application and Proxy server,
- we configure
/etc/httpd/conf.d/mod_jk.conf as per
F=/etc/httpd/conf.d/mod_jk.conf
printf 'LoadModule jk_module modules/mod_jk.so\n' > ${F}
printf 'JkWorkersFile conf/workers.properties\n' >> ${F}
printf 'JkLogFile logs/mod_jk.log\n' >> ${F}
printf 'JkLogLevel info\n' >> ${F}
printf 'JkLogStampFormat  "[%%a %%b %%d %%H:%%M:%%S %%Y]"\n' >> ${F}
printf 'JkOptions +ForwardKeySize +ForwardURICompat +ForwardSSLCertChain -ForwardDirectories\n' >> ${F}
printf 'JkRequestLogFormat "%%w %%V %%T"\n' >> ${F}
printf 'JkMount /stroom* loadbalancer\n' >> ${F}
printf 'JkMount /stroom/remoting/cluster* local\n' >> ${F}
printf 'JkMount /stroom/datafeed* loadbalancer_proxy\n' >> ${F}
printf 'JkMount /stroom/remoting* loadbalancer_proxy\n' >> ${F}
printf 'JkMount /stroom/datafeed/direct* loadbalancer\n' >> ${F}
printf '# Note: Replaced JkShmFile logs/jk.shm due to SELinux issues. Refer to\n' >> ${F}
printf '# https://bugzilla.redhat.com/bugzilla/show_bug.cgi?id=225452\n' >> ${F}
printf '# The following makes use of the existing /run/httpd directory\n' >> ${F}
printf 'JkShmFile run/jk.shm\n' >> ${F}
printf '<Location /jkstatus/>\n' >> ${F}
printf '  JkMount status\n' >> ${F}
printf '  Order deny,allow\n' >> ${F}
printf '  Deny from all\n' >> ${F}
printf '  Allow from 127.0.0.1\n' >> ${F}
printf '</Location>\n' >> ${F}
chmod 640 ${F}
- we configure
/etc/httpd/conf/workers.properties as per
Since we are deploying for a cluster with load balancing, we need a workers.properties file per node. Executing the following will result in two files (workers.properties.stroomp00 and workers.properties.stroomp01) which should be deployed to their respective servers.
cd /tmp
# Set the list of nodes
Nodes="stroomp00.strmdev00.org stroomp01.strmdev00.org"
for oN in ${Nodes}; do
  _n=`echo ${oN} | cut -f1 -d\.`
  (
  printf '# Workers.properties for Stroom Cluster member: %s %s\n' ${oN}
  printf 'worker.list=loadbalancer,loadbalancer_proxy,local,local_proxy,status\n'
  L_t=""
  Lp_t=""
  for FQDN in ${Nodes}; do
    N=`echo ${FQDN} | cut -f1 -d\.`
    printf 'worker.%s.port=8009\n' ${N}
    printf 'worker.%s.host=%s\n' ${N} ${FQDN}
    printf 'worker.%s.type=ajp13\n' ${N}
    printf 'worker.%s.lbfactor=1\n' ${N}
    printf 'worker.%s.max_packet_size=65536\n' ${N}
    printf 'worker.%s_proxy.port=9009\n' ${N}
    printf 'worker.%s_proxy.host=%s\n' ${N} ${FQDN}
    printf 'worker.%s_proxy.type=ajp13\n' ${N}
    printf 'worker.%s_proxy.lbfactor=1\n' ${N}
    printf 'worker.%s_proxy.max_packet_size=65536\n' ${N}
    L_t="${L_t}${N},"
    Lp_t="${Lp_t}${N}_proxy,"
  done
  L=`echo $L_t | sed -e 's/.$//'`
  Lp=`echo $Lp_t | sed -e 's/.$//'`
  printf 'worker.loadbalancer.type=lb\n'
  printf 'worker.loadbalancer.balance_workers=%s\n' $L
  printf 'worker.loadbalancer.sticky_session=1\n'
  printf 'worker.loadbalancer_proxy.type=lb\n'
  printf 'worker.loadbalancer_proxy.balance_workers=%s\n' $Lp
  printf 'worker.loadbalancer_proxy.sticky_session=1\n'
  printf 'worker.local.type=lb\n'
  printf 'worker.local.balance_workers=%s\n' ${_n}
  printf 'worker.local.sticky_session=1\n'
  printf 'worker.local_proxy.type=lb\n'
  printf 'worker.local_proxy.balance_workers=%s_proxy\n' ${_n}
  printf 'worker.local_proxy.sticky_session=1\n'
  printf 'worker.status.type=status\n'
  ) > workers.properties.${_n}
  chmod 640 workers.properties.${_n}
done
Now depending in the node you are on, copy the relevant workers.properties.nodename file to /etc/httpd/conf/workers.properties. The following command makes this simple.
cp workers.properties.`hostname -s` /etc/httpd/conf/workers.properties
If you were to add an additional node to a multi node cluster, say the node stroomp02.strmdev00.org, then you would re-run the above script with
Nodes="stroomp00.strmdev00.org stroomp01.strmdev00.org stroomp02.strmdev00.org"
then redeploy all three files to the respective servers. Also note, that for the newly created workers.properties files for the existing nodes to
take effect you will need to restart the Apache Httpd service on both nodes.
Remember, in multi node cluster deployments, the following files are the same and hence can be created on one node, but copied to the
others not forgetting to backup the other node’s original files. That is, the files
- /var/www/html/index.html
- /etc/httpd/conf.d/mod_jk.conf
- /etc/httpd/conf/httpd.conf
are to be the same on all nodes. Only the /etc/httpd/conf.d/ssl.conf and /etc/httpd/conf/workers.properties files change.
Mod_JK Standalone or Forwarding Stroom Proxy Deployment
For a Stroom Standalone or Forwarding proxy,
- we configure
/etc/httpd/conf.d/mod_jk.conf as per
F=/etc/httpd/conf.d/mod_jk.conf
printf 'LoadModule jk_module modules/mod_jk.so\n' > ${F}
printf 'JkWorkersFile conf/workers.properties\n' >> ${F}
printf 'JkLogFile logs/mod_jk.log\n' >> ${F}
printf 'JkLogLevel info\n' >> ${F}
printf 'JkLogStampFormat  "[%%a %%b %%d %%H:%%M:%%S %%Y]"\n' >> ${F}
printf 'JkOptions +ForwardKeySize +ForwardURICompat +ForwardSSLCertChain -ForwardDirectories\n' >> ${F}
printf 'JkRequestLogFormat "%%w %%V %%T"\n' >> ${F}
printf 'JkMount /stroom/datafeed* local_proxy\n' >> ${F}
printf '# Note: Replaced JkShmFile logs/jk.shm due to SELinux issues. Refer to\n' >> ${F}
printf '# https://bugzilla.redhat.com/bugzilla/show_bug.cgi?id=225452\n' >> ${F}
printf '# The following makes use of the existing /run/httpd directory\n' >> ${F}
printf 'JkShmFile run/jk.shm\n' >> ${F}
printf '<Location /jkstatus/>\n' >> ${F}
printf '  JkMount status\n' >> ${F}
printf '  Order deny,allow\n' >> ${F}
printf '  Deny from all\n' >> ${F}
printf '  Allow from 127.0.0.1\n' >> ${F}
printf '</Location>\n' >> ${F}
chmod 640 ${F}
- we configure
/etc/httpd/conf/workers.properties as per
The variable N in the script below is to be the node name (not FQDN) of your sever (i.e. stroomfp0).
N=stroomfp0
FQDN=`hostname -f`
F=/etc/httpd/conf/workers.properties
printf 'worker.list=local_proxy,status\n' > ${F}
printf 'worker.%s_proxy.port=9009\n' ${N} >> ${F}
printf 'worker.%s_proxy.host=%s\n' ${N} ${FQDN} >> ${F}
printf 'worker.%s_proxy.type=ajp13\n' ${N} >> ${F}
printf 'worker.%s_proxy.lbfactor=1\n' ${N} >> ${F}
printf 'worker.local_proxy.type=lb\n' >> ${F}
printf 'worker.local_proxy.balance_workers=%s_proxy\n' ${N} >> ${F}
printf 'worker.local_proxy.sticky_session=1\n' >> ${F}
printf 'worker.status.type=status\n' >> ${F}
chmod 640 ${F}
Mod_JK Single Node Application and Proxy Deployment
For a Stroom Single node Application and Proxy server,
- we configure
/etc/httpd/conf.d/mod_jk.conf as per
F=/etc/httpd/conf.d/mod_jk.conf
printf 'LoadModule jk_module modules/mod_jk.so\n' > ${F}
printf 'JkWorkersFile conf/workers.properties\n' >> ${F}
printf 'JkLogFile logs/mod_jk.log\n' >> ${F}
printf 'JkLogLevel info\n' >> ${F}
printf 'JkLogStampFormat  "[%%a %%b %%d %%H:%%M:%%S %%Y]"\n' >> ${F}
printf 'JkOptions +ForwardKeySize +ForwardURICompat +ForwardSSLCertChain -ForwardDirectories\n' >> ${F}
printf 'JkRequestLogFormat "%%w %%V %%T"\n' >> ${F}
printf 'JkMount /stroom* local\n' >> ${F}
printf 'JkMount /stroom/remoting/cluster* local\n' >> ${F}
printf 'JkMount /stroom/datafeed* local_proxy\n' >> ${F}
printf 'JkMount /stroom/remoting* local_proxy\n' >> ${F}
printf 'JkMount /stroom/datafeed/direct* local\n' >> ${F}
printf '# Note: Replaced JkShmFile logs/jk.shm due to SELinux issues. Refer to\n' >> ${F}
printf '# https://bugzilla.redhat.com/bugzilla/show_bug.cgi?id=225452\n' >> ${F}
printf '# The following makes use of the existing /run/httpd directory\n' >> ${F}
printf 'JkShmFile run/jk.shm\n' >> ${F}
printf '<Location /jkstatus/>\n' >> ${F}
printf '  JkMount status\n' >> ${F}
printf '  Order deny,allow\n' >> ${F}
printf '  Deny from all\n' >> ${F}
printf '  Allow from 127.0.0.1\n' >> ${F}
printf '</Location>\n' >> ${F}
chmod 640 ${F}
- we configure
/etc/httpd/conf/workers.properties as per
The variable N in the script below is to be the node name (not FQDN) of your sever (i.e. stroomp00).
N=stroomp00
FQDN=`hostname -f`
F=/etc/httpd/conf/workers.properties
printf 'worker.list=local,local_proxy,status\n' > ${F}
printf 'worker.%s.port=8009\n' ${N} >> ${F}
printf 'worker.%s.host=%s\n' ${N} ${FQDN} >> ${F}
printf 'worker.%s.type=ajp13\n' ${N} >> ${F}
printf 'worker.%s.lbfactor=1\n' ${N} >> ${F}
printf 'worker.%s.max_packet_size=65536\n' ${N} >> ${F}
printf 'worker.%s_proxy.port=9009\n' ${N} >> ${F}
printf 'worker.%s_proxy.host=%s\n' ${N} ${FQDN} >> ${F}
printf 'worker.%s_proxy.type=ajp13\n' ${N} >> ${F}
printf 'worker.%s_proxy.lbfactor=1\n' ${N} >> ${F}
printf 'worker.%s_proxy.max_packet_size=65536\n' ${N} >> ${F}
printf 'worker.local.type=lb\n' >> ${F}
printf 'worker.local.balance_workers=%s\n' ${N} >> ${F}
printf 'worker.local.sticky_session=1\n' >> ${F}
printf 'worker.local_proxy.type=lb\n' >> ${F}
printf 'worker.local_proxy.balance_workers=%s_proxy\n' ${N} >> ${F}
printf 'worker.local_proxy.sticky_session=1\n' >> ${F}
printf 'worker.status.type=status\n' >> ${F}
chmod 640 ${F}
Final host configuration and web service enablement
Now tidy up the SELinux context for access on all nodes and files via the commands
setsebool -P httpd_enable_homedirs on
setsebool -P httpd_can_network_connect on
chcon --reference /etc/httpd/conf.d/README /etc/httpd/conf.d/mod_jk.conf
chcon --reference /etc/httpd/conf/magic /etc/httpd/conf/workers.properties
We also enable both http and https services via the firewall on all nodes. If you don’t want to present a http access point,
then don’t enable it in the firewall setting. This is done with
firewall-cmd --zone=public --add-service=http --permanent
firewall-cmd --zone=public --add-service=https --permanent
firewall-cmd --reload
firewall-cmd --zone=public --list-all
Finally enable then start the httpd service, correcting any errors. It should be noted that on any errors,
the suggestion of a systemctl status or viewing the journal are good, but also review information in the httpd error logs found in /var/log/httpd/.
systemctl enable httpd.service
systemctl start httpd.service
4.2 - Database Installation
This HOWTO describes the installation of the Stroom databases.
Following this HOWTO will produce a simple, minimally secured database deployment. In a production environment consideration needs to be made for redundancy, better security, data-store location, increased memory usage, and the like.
Stroom has two databases. The first, stroom, is used for management of Stroom itself and the second, statistics is used for the Stroom Statistics capability. There are many ways to deploy these two databases. One could
- have a single database instance and serve both databases from it
- have two database instances on the same server and serve one database per instance
- have two separate nodes, each with it’s own database instance
- the list goes on.
In this HOWTO, we describe the deployment of two database instances on the one node, each serving a single database. We provide example deployments using either the MariaDB (external link) or MySQL Community (external link) versions of MySQL.
Assumptions
- we are installing the MariaDB or MySQL Community RDBMS software.
- the primary database node is ‘stroomdb0.strmdev00.org’.
- installation is on a fully patched minimal Centos 7.3 instance.
- we are installing BOTH databases (
stroom and statistics) on the same node - ‘stroomdb0.stromdev00.org’ but with two distinct database engines. The first database will communicate on port 3307 and the second on 3308.
- we are deploying with SELinux in enforcing mode.
- any scripts or commands that should run are in code blocks and are designed to allow the user to cut then paste the commands onto their systems.
- in this document, when a textual screen capture is documented, data entry is identified by the data surrounded by ‘<’ ‘>’ . This excludes enter/return presses.
Installation of Software
MariaDB Server Installation
As MariaDB is directly supported by Centos 7, we simply install the database server software and SELinux policy files, as per
sudo yum -y install policycoreutils-python mariadb-server
As MySQL is not directly supported by Centos 7, we need to install it’s repository files prior to installation.
We get the current MySQL Community release repository rpm and validate it’s MD5 checksum against the published value found on the
MySQL Yum Repository (external link) site.
wget https://repo.mysql.com/mysql57-community-release-el7.rpm
md5sum mysql57-community-release-el7.rpm
On correct validation of the MD5 checksum, we install the repository files via
sudo yum -y localinstall mysql57-community-release-el7.rpm
NOTE: Stroom currently does not support the latest production MySQL version - 5.7. You will need to install MySQL Version 5.6.
Now since we must use MySQL Version 5.6 you will need to edit the MySQL repo file /etc/yum.repos.d/mysql-community.repo to
disable the mysql57-community channel and enable the mysql56-community channel. We start by, backing up the repo file with
sudo cp /etc/yum.repos.d/mysql-community.repo /etc/yum.repos.d/mysql-community.repo.ORIG
Then edit the file to change
...
# Enable to use MySQL 5.6
[mysql56-community]
name=MySQL 5.6 Community Server
baseurl=http://repo.mysql.com/yum/mysql-5.6-community/el/7/$basearch/
enabled=0
gpgcheck=1
gpgkey=file:///etc/pki/rpm-gpg/RPM-GPG-KEY-mysql

[mysql57-community]
name=MySQL 5.7 Community Server
baseurl=http://repo.mysql.com/yum/mysql-5.7-community/el/7/$basearch/
enabled=1
gpgcheck=1
gpgkey=file:///etc/pki/rpm-gpg/RPM-GPG-KEY-mysql
...
to become
...
# Enable to use MySQL 5.6
[mysql56-community]
name=MySQL 5.6 Community Server
baseurl=http://repo.mysql.com/yum/mysql-5.6-community/el/7/$basearch/
enabled=1
gpgcheck=1
gpgkey=file:///etc/pki/rpm-gpg/RPM-GPG-KEY-mysql

[mysql57-community]
name=MySQL 5.7 Community Server
baseurl=http://repo.mysql.com/yum/mysql-5.7-community/el/7/$basearch/
enabled=0
gpgcheck=1
gpgkey=file:///etc/pki/rpm-gpg/RPM-GPG-KEY-mysql
...
Next we install server software and SELinux policy files, as per
sudo yum -y install policycoreutils-python mysql-community-server
Preparing the Database Deployment
MariaDB Variant
Create and instantiate both database instances
To set up two MariaDB database instances on the one node, we will use mysql_multi and systemd service templates. The mysql_multi utility is a capability that manages multiple MariaDB databases on the same node and systemd service templates manage multiple services from one configuration file. A systemd service template is unique in that it has an @ character before the .service suffix.
To use this multiple-instance capability, we need to create two data directories for each database instance and also replace the main MariaDB configuration file, /etc/my.cnf, with one that includes configuration of key options for each instance. We will name our instances, mysqld0 and mysqld1. We will also create specific log files for each instance.
We will use the directories, /var/lib/mysql-mysqld0 and /var/lib/mysql-mysqld1 for the data directories and /var/log/mariadb/mysql-mysqld0.log and /var/log/mariadb/mysql-mysqld1.log for the log files. Note you should modify /etc/logrotate.d/mariadb to manage these log files. Note also, we need to set the appropriate SELinux file contexts on the created directories and any files.
We create the data directories and log files and set their respective SELinux contexts via
sudo mkdir /var/lib/mysql-mysqld0
sudo chown mysql:mysql /var/lib/mysql-mysqld0
sudo semanage fcontext -a -t mysqld_db_t "/var/lib/mysql-mysqld0(/.*)?"
sudo restorecon -Rv /var/lib/mysql-mysqld0

sudo touch /var/log/mariadb/mysql-mysqld0.log
sudo chown mysql:mysql /var/log/mariadb/mysql-mysqld0.log
sudo chcon --reference=/var/log/mariadb/mariadb.log /var/log/mariadb/mysql-mysqld0.log

sudo mkdir /var/lib/mysql-mysqld1
sudo chown mysql:mysql /var/lib/mysql-mysqld1
sudo semanage fcontext -a -t mysqld_db_t "/var/lib/mysql-mysqld1(/.*)?"
sudo restorecon -Rv /var/lib/mysql-mysqld1

sudo touch /var/log/mariadb/mysql-mysqld1.log
sudo chown mysql:mysql /var/log/mariadb/mysql-mysqld1.log
sudo chcon --reference=/var/log/mariadb/mariadb.log /var/log/mariadb/mysql-mysqld1.log
We now initialise the our two database data directories via
sudo mysql_install_db --user=mysql --datadir=/var/lib/mysql-mysqld0
sudo mysql_install_db --user=mysql --datadir=/var/lib/mysql-mysqld1
We now replace the MySQL configuration file to set the options for each instance. Note that we will serve mysqld0 and mysqld1 via TCP ports 3307 and 3308 respectively. First backup the existing configuration file with
sudo cp /etc/my.cnf /etc/my.cnf.ORIG
then setup /etc/my.cnf as per
sudo bash
F=/etc/my.cnf
printf '[mysqld_multi]\n' > ${F}
printf 'mysqld = /usr/bin/mysqld_safe --basedir=/usr\n' >> ${F}
printf '\n' >> ${F}
printf '[mysqld0]\n' >> ${F}
printf 'port=3307\n' >> ${F}
printf 'mysqld = /usr/bin/mysqld_safe --basedir=/usr\n' >> ${F}
printf 'datadir=/var/lib/mysql-mysqld0/\n' >> ${F}
printf 'socket=/var/lib/mysql-mysqld0/mysql.sock\n' >> ${F}
printf 'pid-file=/var/run/mariadb/mysql-mysqld0.pid\n' >> ${F}
printf '\n' >> ${F}
printf 'log-error=/var/log/mariadb/mysql-mysqld0.log\n' >> ${F}
printf '\n' >> ${F}
printf '# Disabling symbolic-links is recommended to prevent assorted security\n' >> ${F}
printf '# risks\n' >> ${F}
printf 'symbolic-links=0\n' >> ${F}
printf '\n' >> ${F}
printf '[mysqld1]\n' >> ${F}
printf 'mysqld = /usr/bin/mysqld_safe --basedir=/usr\n' >> ${F}
printf 'port=3308\n' >> ${F}
printf 'datadir=/var/lib/mysql-mysqld1/\n' >> ${F}
printf 'socket=/var/lib/mysql-mysqld1/mysql.sock\n' >> ${F}
printf 'pid-file=/var/run/mariadb/mysql-mysqld1.pid\n' >> ${F}
printf '\n' >> ${F}
printf 'log-error=/var/log/mariadb/mysql-mysqld1.log\n' >> ${F}
printf '\n' >> ${F}
printf '# Disabling symbolic-links is recommended to prevent assorted security risks\n' >> ${F}
printf 'symbolic-links=0\n' >> ${F}
exit # To exit the root shell
We also need to associate the ports with the mysqld_port_t SELinux context as per
sudo semanage port -a -t mysqld_port_t -p tcp 3307
sudo semanage port -a -t mysqld_port_t -p tcp 3308
We next create the systemd service template as per
sudo bash
F=/etc/systemd/system/mysqld@.service

printf '# Install in /etc/systemd/system\n' > ${F}
printf '# Enable via systemctl enable mysqld@0 or systemctl enable mysqld@1\n' >> ${F}
printf '[Unit]\n' >> ${F}
printf 'Description=MySQL Multi Server for instance %%i\n' >> ${F}
printf 'After=syslog.target\n' >> ${F}
printf 'After=network.target\n' >> ${F}
printf '\n' >> ${F}
printf '[Service]\n' >> ${F}
printf 'User=mysql\n' >> ${F}
printf 'Group=mysql\n' >> ${F}
printf 'Type=forking\n' >> ${F}
printf 'ExecStart=/usr/bin/mysqld_multi start %%i\n' >> ${F}
printf 'ExecStop=/usr/bin/mysqld_multi stop %%i\n' >> ${F}
printf 'Restart=always\n' >> ${F}
printf 'PrivateTmp=true\n' >> ${F}
printf '\n' >> ${F}
printf '[Install]\n' >> ${F}
printf 'WantedBy=multi-user.target\n' >> ${F}
chmod 644 ${F}
exit; # to exit the root shell
We next enable and start both instances via
sudo systemctl enable mysqld@0
sudo systemctl enable mysqld@1
sudo systemctl start mysqld@0
sudo systemctl start mysqld@1
At this we should have both instances running. One should check each instance’s log file for any errors.
Secure each database instance
We secure each database engine by running the mysql_secure_installation script. One should accept all defaults, which means the
only entry (aside from pressing returns) is the administrator (root) database password. Make a note of the password you use. In this case
we will use Stroom5User@.
The utility mysql_secure_installation expects to find the Linux socket file to access the database it’s securing at /var/lib/mysql/mysql.sock.
Since we have used other locations, we temporarily link the real socket file to /var/lib/mysql/mysql.sock for each invocation of the
utility. Thus we execute
sudo ln /var/lib/mysql-mysqld0/mysql.sock /var/lib/mysql/mysql.sock
sudo mysql_secure_installation
to see
NOTE: RUNNING ALL PARTS OF THIS SCRIPT IS RECOMMENDED FOR ALL MariaDB
      SERVERS IN PRODUCTION USE!  PLEASE READ EACH STEP CAREFULLY!

In order to log into MariaDB to secure it, we'll need the current
password for the root user.  If you've just installed MariaDB, and
you haven't set the root password yet, the password will be blank,
so you should just press enter here.

Enter current password for root (enter for none):
OK, successfully used password, moving on...

Setting the root password ensures that nobody can log into the MariaDB
root user without the proper authorisation.

Set root password? [Y/n]
New password: <__ Stroom5User@ __>
Re-enter new password: <__ Stroom5User@ __>
Password updated successfully!
Reloading privilege tables..
 ... Success!


By default, a MariaDB installation has an anonymous user, allowing anyone
to log into MariaDB without having to have a user account created for
them.  This is intended only for testing, and to make the installation
go a bit smoother.  You should remove them before moving into a
production environment.

Remove anonymous users? [Y/n]
 ... Success!

Normally, root should only be allowed to connect from 'localhost'.  This
ensures that someone cannot guess at the root password from the network.

Disallow root login remotely? [Y/n]
 ... Success!

By default, MariaDB comes with a database named 'test' that anyone can
access.  This is also intended only for testing, and should be removed
before moving into a production environment.

Remove test database and access to it? [Y/n]
 - Dropping test database...
 ... Success!
 - Removing privileges on test database...
 ... Success!

Reloading the privilege tables will ensure that all changes made so far
will take effect immediately.

Reload privilege tables now? [Y/n]
... Success!

Cleaning up...

All done!  If you've completed all of the above steps, your MariaDB
installation should now be secure.

Thanks for using MariaDB!
then we execute
sudo rm /var/lib/mysql/mysql.sock
sudo ln /var/lib/mysql-mysqld1/mysql.sock /var/lib/mysql/mysql.sock
sudo mysql_secure_installation
sudo rm /var/lib/mysql/mysql.sock
and process as before (for when running mysql_secure_installation). At this both database instances should be secure.
Create and instantiate both database instances
To set up two MySQL database instances on the one node, we will use mysql_multi and systemd service templates. The mysql_multi utility is a capability that manages multiple MySQL databases on the same node and systemd service templates manage multiple services from one configuration file. A systemd service template is unique in that it has an @ character before the .service suffix.
To use this multiple-instance capability, we need to create two data directories for each database instance and also replace the main MySQL configuration file, /etc/my.cnf, with one that includes configuration of key options for each instance. We will name our instances, mysqld0 and mysqld1. We will also create specific log files for each instance.
We will use the directories, /var/lib/mysql-mysqld0 and /var/lib/mysql-mysqld1 for the data directories and /var/log/mysql-mysqld0.log and /var/log/mysql-mysqld1.log for the log directories. Note you should modify /etc/logrotate.d/mysql to manage these log files. Note also, we need to set the appropriate SELinux file context on the created directories and files.
sudo mkdir /var/lib/mysql-mysqld0
sudo chown mysql:mysql /var/lib/mysql-mysqld0
sudo semanage fcontext -a -t mysqld_db_t "/var/lib/mysql-mysqld0(/.*)?"
sudo restorecon -Rv /var/lib/mysql-mysqld0

sudo touch /var/log/mysql-mysqld0.log
sudo chown mysql:mysql /var/log/mysql-mysqld0.log
sudo chcon --reference=/var/log/mysqld.log /var/log/mysql-mysqld0.log

sudo mkdir /var/lib/mysql-mysqld1
sudo chown mysql:mysql /var/lib/mysql-mysqld1
sudo semanage fcontext -a -t mysqld_db_t "/var/lib/mysql-mysqld1(/.*)?"
sudo restorecon -Rv /var/lib/mysql-mysqld1

sudo touch /var/log/mysql-mysqld1.log
sudo chown mysql:mysql /var/log/mysql-mysqld1.log
sudo chcon --reference=/var/log/mysqld.log /var/log/mysql-mysqld1.log
We now initialise the our two database data directories via
sudo mysql_install_db --user=mysql --datadir=/var/lib/mysql-mysqld0
sudo mysql_install_db --user=mysql --datadir=/var/lib/mysql-mysqld1
Disable the default database via
sudo systemctl disable mysqld
We now modify the MySQL configuration file to set the options for each instance. Note that we will serve mysqld0 and mysqld1 via TCP ports 3307 and 3308 respectively. First backup the existing configuration file with
sudo cp /etc/my.cnf /etc/my.cnf.ORIG
then setup /etc/my.cnf as per
sudo bash
F=/etc/my.cnf
printf '[mysqld_multi]\n' > ${F}
printf 'mysqld = /usr/bin/mysqld_safe --basedir=/usr\n' >> ${F}
printf '\n' >> ${F}
printf '[mysqld0]\n' >> ${F}
printf 'port=3307\n' >> ${F}
printf 'mysqld = /usr/bin/mysqld_safe --basedir=/usr\n' >> ${F}
printf 'datadir=/var/lib/mysql-mysqld0/\n' >> ${F}
printf 'socket=/var/lib/mysql-mysqld0/mysql.sock\n' >> ${F}
printf 'pid-file=/var/run/mysqld/mysql-mysqld0.pid\n' >> ${F}
printf '\n' >> ${F}
printf 'log-error=/var/log/mysql-mysqld0.log\n' >> ${F}
printf '\n' >> ${F}
printf '# Disabling symbolic-links is recommended to prevent assorted security\n' >> ${F}
printf '# risks\n' >> ${F}
printf 'symbolic-links=0\n' >> ${F}
printf '\n' >> ${F}
printf '[mysqld1]\n' >> ${F}
printf 'mysqld = /usr/bin/mysqld_safe --basedir=/usr\n' >> ${F}
printf 'port=3308\n' >> ${F}
printf 'datadir=/var/lib/mysql-mysqld1/\n' >> ${F}
printf 'socket=/var/lib/mysql-mysqld1/mysql.sock\n' >> ${F}
printf 'pid-file=/var/run/mysqld/mysql-mysqld1.pid\n' >> ${F}
printf '\n' >> ${F}
printf 'log-error=/var/log/mysql-mysqld1.log\n' >> ${F}
printf '\n' >> ${F}
printf '# Disabling symbolic-links is recommended to prevent assorted security risks\n' >> ${F}
printf 'symbolic-links=0\n' >> ${F}
exit # To exit the root shell
We also need to associate the ports with the mysqld_port_t SELinux context as per
sudo semanage port -a -t mysqld_port_t -p tcp 3307
sudo semanage port -a -t mysqld_port_t -p tcp 3308
We next create the systemd service template as per
sudo bash
F=/etc/systemd/system/mysqld@.service

printf '# Install in /etc/systemd/system\n' > ${F}
printf '# Enable via systemctl enable mysqld@0 or systemctl enable mysqld@1\n' >> ${F}
printf '[Unit]\n' >> ${F}
printf 'Description=MySQL Multi Server for instance %%i\n' >> ${F}
printf 'After=syslog.target\n' >> ${F}
printf 'After=network.target\n' >> ${F}
printf '\n' >> ${F}
printf '[Service]\n' >> ${F}
printf 'User=mysql\n' >> ${F}
printf 'Group=mysql\n' >> ${F}
printf 'Type=forking\n' >> ${F}
printf 'ExecStart=/usr/bin/mysqld_multi start %%i\n' >> ${F}
printf 'ExecStop=/usr/bin/mysqld_multi stop %%i\n' >> ${F}
printf 'Restart=always\n' >> ${F}
printf 'PrivateTmp=true\n' >> ${F}
printf '\n' >> ${F}
printf '[Install]\n' >> ${F}
printf 'WantedBy=multi-user.target\n' >> ${F}
chmod 644 ${F}
exit; # to exit the root shell
We next enable and start both instances via
sudo systemctl enable mysqld@0
sudo systemctl enable mysqld@1
sudo systemctl start mysqld@0
sudo systemctl start mysqld@1
At this we should have both instances running. One should check each instance’s log file for any errors.
Secure each database instance
We secure each database engine by running the mysql_secure_installation script. One should accept all defaults, which means the
only entry (aside from pressing returns) is the administrator (root) database password. Make a note of the password you use. In this case
we will use Stroom5User@.
The utility mysql_secure_installation expects to find the Linux socket file to access the database it’s securing at /var/lib/mysql/mysql.sock.
Since we have used other locations, we temporarily link the real socket file to /var/lib/mysql/mysql.sock for each invocation of the
utility. Thus we execute
sudo ln /var/lib/mysql-mysqld0/mysql.sock /var/lib/mysql/mysql.sock
sudo mysql_secure_installation
to see
NOTE: RUNNING ALL PARTS OF THIS SCRIPT IS RECOMMENDED FOR ALL MySQL
      SERVERS IN PRODUCTION USE!  PLEASE READ EACH STEP CAREFULLY!

In order to log into MySQL to secure it, we'll need the current
password for the root user.  If you've just installed MySQL, and
you haven't set the root password yet, the password will be blank,
so you should just press enter here.

Enter current password for root (enter for none):
OK, successfully used password, moving on...

Setting the root password ensures that nobody can log into the MySQL
root user without the proper authorisation.

Set root password? [Y/n] y
New password: <__ Stroom5User@ __>
Re-enter new password: <__ Stroom5User@ __>
Password updated successfully!
Reloading privilege tables..
 ... Success!


By default, a MySQL installation has an anonymous user, allowing anyone
to log into MySQL without having to have a user account created for
them.  This is intended only for testing, and to make the installation
go a bit smoother.  You should remove them before moving into a
production environment.

Remove anonymous users? [Y/n]
 ... Success!

Normally, root should only be allowed to connect from 'localhost'.  This
ensures that someone cannot guess at the root password from the network.

Disallow root login remotely? [Y/n]
 ... Success!

By default, MySQL comes with a database named 'test' that anyone can
access.  This is also intended only for testing, and should be removed
before moving into a production environment.

Remove test database and access to it? [Y/n]
 - Dropping test database...
ERROR 1008 (HY000) at line 1: Can't drop database 'test'; database doesn't exist
 ... Failed!  Not critical, keep moving...
 - Removing privileges on test database...
 ... Success!

Reloading the privilege tables will ensure that all changes made so far
will take effect immediately.

Reload privilege tables now? [Y/n]
 ... Success!


All done!  If you've completed all of the above steps, your MySQL
installation should now be secure.

Thanks for using MySQL!


Cleaning up...
then we execute
sudo rm /var/lib/mysql/mysql.sock
sudo ln /var/lib/mysql-mysqld1/mysql.sock /var/lib/mysql/mysql.sock
sudo mysql_secure_installation
sudo rm /var/lib/mysql/mysql.sock
and process as before (for when running mysql_secure_installation). At this both database instances should be secure.
Create the Databases and Enable access by the Stroom processing users
We now create the stroom database within the first instance, mysqld0 and the statistics database within the second
instance mysqld1. It does not matter which database variant used as all commands are the same for both.
As well as creating the databases, we also need to establish the Stroom processing users
that the Stroom processing nodes will use to access each database.
For the stroom database, we will use the database user stroomuser with a password of Stroompassword1@ and for the statistics database, we will use the database user stroomstats with a password of Stroompassword2@. One identifies a processing user as <user>@<host> on a grant SQL command.
In the stroom database instance, we will grant access for
stroomuser@localhost for local access for maintenance etc.stroomuser@stroomp00.strmdev00.org for access by processing node stroomp00.strmdev00.orgstroomuser@stroomp01.strmdev00.org for access by processing node stroomp01.strmdev00.org
and in the statistics database instance, we will grant access for
stroomstats@localhost for local access for maintenance etc.stroomstats@stroomp00.strmdev00.org for access by processing node stroomp00.strmdev00.orgstroomstats@stroomp01.strmdev00.org for access by processing node stroomp01.strmdev00.org
Thus for the stroom database we execute
mysql --user=root --port=3307 --socket=/var/lib/mysql-mysqld0/mysql.sock --password
and on entering the administrator’s password, we arrive at the MariaDB [(none)]> or mysql> prompt. At this we create the database with
create database stroom;
and then to establish the users, we execute
grant all privileges on stroom.* to stroomuser@localhost identified by 'Stroompassword1@';
grant all privileges on stroom.* to stroomuser@stroomp00.strmdev00.org identified by 'Stroompassword1@';
grant all privileges on stroom.* to stroomuser@stroomp01.strmdev00.org identified by 'Stroompassword1@';
then
quit;
to exit.
And for the statistics database
mysql --user=root --port=3308 --socket=/var/lib/mysql-mysqld1/mysql.sock --password
with
create database statistics;
and then to establish the users, we execute
grant all privileges on statistics.* to stroomstats@localhost identified by 'Stroompassword2@';
grant all privileges on statistics.* to stroomstats@stroomp00.strmdev00.org identified by 'Stroompassword2@';
grant all privileges on statistics.* to stroomstats@stroomp01.strmdev00.org identified by 'Stroompassword2@';
then
quit;
to exit.
Clearly if we need to add more processing nodes, additional grant commands would be used. Further, if we were installing the databases in a single node Stroom environment, we would just have the first two pairs of grants.
Next we need to modify our firewall to allow remote access to our databases which listens on ports 3307 and 3308.
The simplest way to achieve this is with the commands
sudo firewall-cmd --zone=public --add-port=3307/tcp --permanent
sudo firewall-cmd --zone=public --add-port=3308/tcp --permanent
sudo firewall-cmd --reload
sudo firewall-cmd --zone=public --list-all
Note
That this allows ANY node to connect to your databases. You should give consideration to restricting this to only allowing processing node access.
Debugging of Mariadb for Stroom
If there is a need to debug the Mariadb database and Stroom interaction, one can turn on auditing for the Mariadb service.
To do so, log onto the relevant database as the administrative user as per
mysql --user=root --port=3307 --socket=/var/lib/mysql-mysqld0/mysql.sock --password
or
mysql --user=root --port=3308 --socket=/var/lib/mysql-mysqld1/mysql.sock --password
and at the MariaDB [(none)]> prompt enter
install plugin server_audit SONAME 'server_audit';
set global server_audit_file_path='/var/log/mariadb/mysqld-mysqld0_server_audit.log';
or
set global server_audit_file_path='/var/log/mariadb/mysqld-mysqld1_server_audit.log';
set global server_audit_logging=ON;
set global server_audit_file_rotate_size=10485760;
install plugin SQL_ERROR_LOG soname 'sql_errlog';
quit;
The above will generate two log files,
/var/log/mariadb/mysqld-mysqld0_server_audit.log or /var/log/mariadb/mysqld-mysqld1_server_audit.log which records all commands the respective databases run. We have configured the log file will rotate at 10MB in size./var/lib/mysql-mysqld0/sql_errors.log or /var/lib/mysql-mysqld1/sql_errors.log which records all erroneous SQL commands. This log file will rotate at 10MB in size. Note we cannot set this filename via the UI, but it will be appear in the data directory.
All files will, by default, generate up to 9 rotated files.
If you wish to rotate a log file manually, log into the database as the administrative user and execute either
set global server_audit_file_rotate_now=1; to rotate the audit log fileset global sql_error_log_rotate=1; to rotate the sql_errlog log file
Initial Database Access
It should be noted that if you monitor the sql_errors.log log file on a new Stooom deployment, when the Stoom Application first starts, it’s initial access to the stroom database will result in the following attempted sql statements.
2017-04-16 16:24:50 stroomuser[stroomuser] @ stroomp00.strmdev00.org [192.168.2.126] ERROR 1146: Table 'stroom.schema_version' doesn't exist : SELECT version FROM schema_version ORDER BY installed_rank DESC
2017-04-16 16:24:50 stroomuser[stroomuser] @ stroomp00.strmdev00.org [192.168.2.126] ERROR 1146: Table 'stroom.STROOM_VER' doesn't exist : SELECT VER_MAJ, VER_MIN, VER_PAT FROM STROOM_VER ORDER BY VER_MAJ DESC, VER_MIN DESC, VER_PAT DESC LIMIT 1
2017-04-16 16:24:50 stroomuser[stroomuser] @ stroomp00.strmdev00.org [192.168.2.126] ERROR 1146: Table 'stroom.FD' doesn't exist : SELECT ID FROM FD LIMIT 1
2017-04-16 16:24:50 stroomuser[stroomuser] @ stroomp00.strmdev00.org [192.168.2.126] ERROR 1146: Table 'stroom.FEED' doesn't exist : SELECT ID FROM FEED LIMIT 1
After this access the application will realise the database does not exist and it will initialise the database.
In the case of the statistics database you may note the following attempted access
2017-04-16 16:25:09 stroomstats[stroomstats] @ stroomp00.strmdev00.org [192.168.2.126] ERROR 1146: Table 'statistics.schema_version' doesn't exist : SELECT version FROM schema_version ORDER BY installed_rank DESC
Again, at this point the application will initialise this database.
4.3 - Installation
This HOWTO is provided to assist users in setting up a number of different Stroom environments based on Centos 7.3 infrastructure.
Assumptions
The following assumptions are used in this document.
- the user has reasonable RHEL/Centos System administration skills.
- installations are on Centos 7.3 minimal systems (fully patched).
- the term ’node’ is used to reference the ‘host’ a service is running on.
- the Stroom Proxy and Application software runs as user ‘stroomuser’ and will be deployed in this user’s home directory
- data will reside in a directory tree referenced via ‘/stroomdata’. It is up to the user to provision a filesystem here, noting sub-directories of it will be NFS shared in Multi Node Stroom Deployments
- any scripts or commands that should run are in code blocks and are designed to allow the user to cut then paste the commands onto their systems
- in this document, when a textual screen capture is documented, data entry is identified by the data surrounded by ‘<’ ‘>’ . This excludes enter/return presses.
- better security of password choices, networking, firewalls, data stores, etc. can and should be achieved in various ways, but these HOWTOs are just a quick means of getting a working system, so only limited security is applied
- better configuration of the database (e.g. more memory. redundancy) should be considered in production environments
- the use of self signed certificates is appropriate for test systems, but users should consider appropriate CA infrastructure in production environments
- the user has access to a Chrome (external link) web browser as Stroom is optimised for this browser.
Introduction
This HOWTO provides guidance on a variety of simple Stroom deployments.
for an environment where multiple nodes are required to handle the processing load.
for extensive networks where one wants to aggregate data through a proxy before sending data to the central Stroom processing systems.
for disconnected networks where collected data can be manually transferred to a Stroom processing service.
for when one needs to add an additional node to an existing cluster.
Nodename Nomenclature
For simplicity sake, the nodenames used in this HOWTO are geared towards the Multi Node Stroom Cluster deployment. That is,
- the database nodename is
stroomdb0.strmdev00.org
- the processing nodenames are
stroomp00.strmdev00.org, stroomp01.strmdev00.org, and stroomp02.strmdev00.org
- the first node in our cluster,
stroomp00.strmdev00.org, also has the CNAME stroomp.strmdev00.org
In the case of the Proxy only deployments,
- the forwarding Stroom proxy nodename is
stoomfp0.strmdev00.org
- the standalone nodename will be
stroomp00.strmdev00.org
Storage
Both the Stroom Proxy and Application store data. The typical requirement is
- directory for Stroom proxy to store inbound data files
- directory for Stroom application permanent data files (events, etc.)
- directory for Stroom application index data files
- directory for Stroom application working files (temporary files, output, etc.)
Where multiple processing nodes are involved, the application’s permanent data directories need to be accessible by all participating nodes.
Thus a hierarchy for a Stroom Proxy might by
and for an Application node
- /stroomdata/stroom-data
- /stroomdata/stroom-index
- /stroomdata/stroom-working
In the following examples, the storage hierarchy proposed will more suited for a multi node Stroom cluster, including the Forwarding or
Standalone proxy deployments. This is to simplify the documentation. Thus, the above structure is generalised into
- /stroomdata/stroom-working-p_nn_/proxy
and
- /stroomdata/stroom-data-p_nn_
- /stroomdata/stroom-index-p_nn_
- /stroomdata/stroom-working-p_nn_
where nn is a two digit node number. The reason for placing the proxy directory within the Application working area
will be explained later.
All data should be owned by the Stroom processing user. In this HOWTO, we will use stroomuser
Multi Node Stroom Cluster (Proxy and Application) Deployment
In this deployment we will install the database on a given node then deploy both the Stroom Proxy and Stroom Application software
to both our processing nodes. At this point we will then integrate a web service to run ‘in-front’ of our Stroom software and
then perform the initial configuration of Stroom via the user interface.
Database Installation
The Stroom capability requires access to two MySQL/MariaDB databases. The first is for persisting application configuration and metadata information, and the second is for the Stroom Statistics capability.
Instructions for installation of the Stroom databases can be found here.
Although these instructions describe the deployment of the databases to their own node, there is no reason why one can’t
just install them both on the first (or only) Stroom node.
Prerequisite Software Installation
Certain software packages are required for either the Stroom Proxy or Stroom Application to run.
The core software list is
- java-1.8.0-openjdk
- java-1.8.0-openjdk-devel
- policycoreutils-python
- unzip
- zip
- mariadb or mysql client
Most of the required software are packages available via standard repositories and hence we can simply execute
sudo yum -y install java-1.8.0-openjdk java-1.8.0-openjdk-devel policycoreutils-python unzip zip
One has a choice of database clients. MariaDB is directly supported by Centos 7 and is simplest to install. This is done via
sudo yum -y install mariadb
One could deploy the MySQL database software as the alternative.
To do this you need to install the MySQL Community repository files then install the client.
Instructions for installation of the MySQL Community repository files can be
found here or on
the MySQL Site (external link).
Once you have installed the MySQL repository files, install the client via
sudo yum -y install mysql-community-client
Note that additional software will be required for other integration components (e.g. Apache httpd/mod_jk). This is
described in the Web Service Integration section of this document.
Note also, that Standalone or Forwarding Stroom Proxy deployments do NOT need a database client deployed.
Entropy Issues in Virtual environments
Both the Stroom Application and Stroom Proxy currently run on Tomcat (Version 7) which relies on the Java SecureRandom class to provide
random values for any generated session identifiers as well as other components. In some circumstances the Java runtime can be delayed if the entropy source that is
used to initialise SecureRandom is short of entropy. The delay is caused by the Java runtime waiting on the blocking entropy souce
/dev/random to have sufficient entropy. This quite often occurs in virtual environments were there are few sources that can contribute to
a system’s entropy.
To view the current available entropy on a Linux system, run the command
cat /proc/sys/kernel/random/entropy_avail
A reasonable value would be over 2000 and a poor value would be below a few hundred.
If you are deploying Stroom onto systems with low available entropy, the start time for the Stroom Proxy can be as high as 5 minutes and for
the Application as high as 15 minutes.
One software based solution would be to install the haveged (external link) service that attempts to provide an easy-to-use, unpredictable random number generator based upon an adaptation of the HAVEGE algorithm.
To install execute
yum -y install haveged
systemctl enable haveged
systemctl start haveged
For background reading in this matter, see this reference (external link) or this reference (external link).
Storage Scenario
For the purpose of this Installation HOWTO, the following sets up the storage hierarchy for a two node processing
cluster. To share our permanent data we will use NFS. Accept that the NFS deployment described here is very simple, and
in a production deployment, a lot more security controls should be used. Further,
Our hierarchy is
- Node:
stroomp00.strmdev00.org
/stroomdata/stroom-data-p00 - location to store Stroom application data files (events, etc.) for this node/stroomdata/stroom-index-p00 - location to store Stroom application index files/stroomdata/stroom-working-p00 - location to store Stroom application working files (e.g. temporary files, output, etc.) for this node/stroomdata/stroom-working-p00/proxy - location for Stroom proxy to store inbound data files- Node:
stroomp01.strmdev00.org
/stroomdata/stroom-data-p01 - location to store Stroom application data files (events, etc.) for this node/stroomdata/stroom-index-p01 - location to store Stroom application index files/stroomdata/stroom-working-p01 - location to store Stroom application working files (e.g. temporary files, output, etc.) for this node/stroomdata/stroom-working-p01/proxy - location for Stroom proxy to store inbound data files
Creation of Storage Hierarchy
So, we first create processing user on all nodes as per
sudo useradd --system stroomuser
And the relevant commands to create the above hierarchy would be
- Node:
stroomp00.strmdev00.org
sudo mkdir -p /stroomdata/stroom-data-p00 /stroomdata/stroom-index-p00 /stroomdata/stroom-working-p00 /stroomdata/stroom-working-p00/proxy
sudo mkdir -p /stroomdata/stroom-data-p01  # So that this node can mount stroomp01's data directory
sudo chown -R stroomuser:stroomuser /stroomdata
sudo chmod -R 750 /stroomdata
- Node:
stroomp01.strmdev00.org
sudo mkdir -p /stroomdata/stroom-data-p01 /stroomdata/stroom-index-p01 /stroomdata/stroom-working-p01 /stroomdata/stroom-working-p01/proxy
sudo mkdir -p /stroomdata/stroom-data-p00  # So that this node can mount stroomp00's data directory
sudo chown -R stroomuser:stroomuser /stroomdata
sudo chmod -R 750 /stroomdata
Deployment of NFS to share Stroom Storage
We will use NFS to cross mount the permanent data directories. That is
- node
stroomp00.strmdev00.org will mount stroomp01.strmdev00.org:/stroomdata/stroom-data-p01 and,
- node
stroomp01.strmdev00.org will mount stroomp00.strmdev00.org:/stroomdata/stroom-data-p00.
The HOWTO guide to deploy and configure NFS for our Scenario is here
Stroom Installation
Pre-installation setup
Before installing either the Stroom Proxy or Stroom Application, we need establish various files and scripts within
the Stroom Processing user’s home directory to support the Stroom services and their persistence. This is setup is described
here.
Stroom Proxy Installation
Instructions for installation of the Stroom Proxy can be found here.
Stroom Application Installation
Instructions for installation of the Stroom application can be found here.
Web Service Integration
One typically ‘fronts’ either a Stroom Proxy or Stroom Application with a secure web service such as Apache’s Httpd or NGINX.
In our scenario, we will use SSL to secure the web service and further, we will use Apache’s Httpd.
We first need to create certificates for use by the web service. The following
provides instructions for this. The created certificates can then be used when configuration the web service.
This HOWTO is designed to deploy Apache’s httpd web service as a front end (https) (to the user) and
Apache’s mod_jk as the interface between Apache and the Stroom tomcat applications. The instructions
to configure this can be found here.
Other Web service capability can be used, for example, NGINX (external link).
Installation Validation
We will now check that the installation and web services integration has worked.
Sanity firewall check
To ensure you have the firewall correctly set up, the following command
sudo firewall-cmd --reload
sudo firewall-cmd --zone=public --list-all
should result in
public (active)
  target: default
  icmp-block-inversion: no
  interfaces: enp0s3
  sources:
  services: dhcpv6-client http https nfs ssh
  ports: 8009/tcp 9080/tcp 8080/tcp 9009/tcp
  protocols:
  masquerade: no
  forward-ports:
  sourceports:
  icmp-blocks:
  rich rules:
Test Posting of data to the Stroom service
You can test the data posting service with the command
curl -k --data-binary @/etc/group "https://stroomp.strmdev00.org/stroom/datafeed" -H "Feed:TEST-FEED-V1_0" -H "System:EXAMPLE_SYSTEM" -H "Environment:EXAMPLE_ENVIRONMENT"
which WILL result in an error as we have not configured the Stroom Application as yet. The error should look like
<html><head><title>Apache Tomcat/7.0.53 - Error report</title><style><!--H1 {font-family:Tahoma,Arial,sans-serif;color:white;background-color:#525D76;font-size:22px;} H2 {font-family:Tahoma,Arial,sans-serif;color:white;background-color:#525D76;font-size:16px;} H3 {font-family:Tahoma,Arial,sans-serif;color:white;background-color:#525D76;font-size:14px;} BODY {font-family:Tahoma,Arial,sans-serif;color:black;background-color:white;} B {font-family:Tahoma,Arial,sans-serif;color:white;background-color:#525D76;} P {font-family:Tahoma,Arial,sans-serif;background:white;color:black;font-size:12px;}A {color : black;}A.name {color : black;}HR {color : #525D76;}--></style> </head><body><h1>HTTP Status 406 - Stroom Status 110 - Feed is not set to receive data - </h1><HR size="1" noshade="noshade"><p><b>type</b> Status report</p><p><b>message</b> <u>Stroom Status 110 - Feed is not set to receive data - </u></p><p><b>description</b> <u>The resource identified by this request is only capable of generating responses with characteristics not acceptable according to the request "accept" headers.</u></p><HR size="1" noshade="noshade"><h3>Apache Tomcat/7.0.53</h3></body></html>
If you view the Stroom proxy log, ~/stroom-proxy/instance/logs/stroom.log, on both processing nodes, you will see on one node,
the datafeed.DataFeedRequestHandler events running under, in this case, the ajp-apr-9009-exec-1 thread indicating the failure
...
2017-01-03T03:35:47.366Z WARN  [ajp-apr-9009-exec-1] datafeed.DataFeedRequestHandler (DataFeedRequestHandler.java:131) - "handleException()","Environment=EXAMPLE_ENVIRONMENT","Expect=100-continue","Feed=TEST-FEED-V1_0","GUID=39960cf9-e50b-4ae8-a5f2-449ee670d2eb","ReceivedTime=2017-01-03T03:35:46.915Z","RemoteAddress=192.168.2.220","RemoteHost=192.168.2.220","System=EXAMPLE_SYSTEM","accept=*/*","content-length=1051","content-type=application/x-www-form-urlencoded","host=stroomp.strmdev00.org","user-agent=curl/7.19.7 (x86_64-redhat-linux-gnu) libcurl/7.19.7 NSS/3.21 Basic ECC zlib/1.2.3 libidn/1.18 libssh2/1.4.2","Stroom Status 110 - Feed is not set to receive data"
2017-01-03T03:35:47.367Z ERROR [ajp-apr-9009-exec-1] zip.StroomStreamException (StroomStreamException.java:131) - sendErrorResponse() - 406 Stroom Status 110 - Feed is not set to receive data -
2017-01-03T03:35:47.368Z INFO  [ajp-apr-9009-exec-1] datafeed.DataFeedRequestHandler$1 (DataFeedRequestHandler.java:104) - "doPost() - Took 478 ms to process (concurrentRequestCount=1) 406","Environment=EXAMPLE_ENVIRONMENT","Expect=100-continue","Feed=TEST-FEED-V1_0","GUID=39960cf9-e50b-4ae8-a5f2-449ee670d2eb","ReceivedTime=2017-01-03T03:35:46.915Z","RemoteAddress=192.168.2.220","RemoteHost=192.168.2.220","System=EXAMPLE_SYSTEM","accept=*/*","content-length=1051","content-type=application/x-www-form-urlencoded","host=stroomp.strmdev00.org","user-agent=curl/7.19.7 (x86_64-redhat-linux-gnu) libcurl/7.19.7 NSS/3.21 Basic ECC zlib/1.2.3 libidn/1.18 libssh2/1.4.2"
...
Further, if you execute the data posting command (curl) multiple times, you will see the loadbalancer working in that,
the above WARN/ERROR/INFO logs will swap between the proxy services (i.e. first error will be in stroomp00.strmdev00.org’s
proxy log file, then second on stroomp01.strmdev00.org’s proxy log file, then back to stroomp00.strmdev00.org and so on).
Stroom Application Configuration
Although we have installed our multi node Stroom cluster, we now need to configure it.
We do this via the user interface (UI).
Logging into the Stroom UI for the first time
To log into the UI of your newly installed Stroom instance, present the base URL to your
Chrome (external link) browser. In this deployment, you should enter the URLS
http://stroomp.strmdev00.org, or https://stroomp.strmdev00.org or https://stroomp.strmdev00.org/stroom, noting the first URLs
should automatically direct you to the last URL.
If you have personal certificates loaded in your Chrome browser, you may be asked which certificate to use to authenticate yourself
to stroomp.strmdev00.org:443. As Stroom has not been configured to use user certificates, the choice is not relevant, just choose one
and continue.
Additionally, if you are using self-signed certificates, your browser will generate an alert as per
To proceed you need to select the ADVANCED hyperlink to see
If you select the Proceed to stroomp.strmdev00.org (unsafe) hyper-link you will be presented with the standard Stroom UI login page.
This page has two panels - About Stroom and Login.
In the About Stroom panel we see an introductory description of Stroom in the top left and deployment details in the bottom left of the panel. The deployment details provide
Build Version: - the build version of the Stroom application deployedBuild Date: - the date the version was builtUp Date: - the install dateNode Name: - the node within the Stroom cluster you have connected to
Login with Stroom default Administrative User
Each new Stroom deployment automatically creates the administrative user admin and this user’s password is initially set to admin.
We will
login as this user
which also validates that the database and UI is working correctly in that you can login and the password is admin.
We should configure Stroom using an attributed user account.
That is, we should
create
a user, in our case it will be burn (the author) and once created, we login with that account then perform the initial configuration activities.
You don’t have to do this, but it is sound security practice.
Once you have created the user you should
log out
of the admin account and log back in as our user burn.
Before we can store data within Stroom we need to configure the
volumes
we have allocated in our Storage hierarchy. The
Volume Maintenance HOWTO
shows how to do this.
In a Stroom cluster, nodes are expected to communicate with each other on port 8080 over http. Our
installation in a multi node environment ensures the firewall will allow this but we also need to
configure the nodes. This is achieved via the Stroom UI where we set a Cluster URL for each node.
The following Node Configuration HOWTO demonstrates how do
set the Cluster URL.
Data Stream Processing
To enable Stroom to process data, it’s
Data Processors
need to be enabled. There are NOT enabled by default on installation. The following
section
in our Stroom Tasks HowTo shows how to do this.
Testing our Stroom Application and Proxy Installation
To complete the installation process we will test that we can send and ingest data.
Add a Test Feed
In order for Stroom to be able to handle various data sources, be they Apache HTTPD web access logs,
MicroSoft Windows Event logs or Squid Proxy logs, Stroom must be told what the data is when it is received.
This is achieved using
Event Feeds.
Each feed has a unique name within the system.
To test our installation can accept and ingest data, we will
create a test Event feed. The ’name’ of the feed will be
TEST-FEED-V1_0. Note that in a production environment is is best that a well defined nomenclature is used for feed ’names’. For our
testing purposes TEST-FEED-V1_0 is sufficient.
Sending Test Data
NOTE: Before testing our new feed, we should restart both our Stroom application services so that any volume changes are
propagated. This can be achieved by simply running
sudo -i -u stroomuser
bin/StopServices.sh
bin/StartServices.sh
on both nodes. It is suggested you first log out of Stroom, if you are currently logged in and you should monitor the Stroom
application logs to ensure it has successfully restarted. Remember to use the T and Tp bash aliases we set up.
For this test, we will send the contents of /etc/group to our test feed. We will also send the file from the cluster’s database
machine. The command to send this file is
curl -k --data-binary @/etc/group "https://stroomp.strmdev00.org/stroom/datafeed" -H "Feed:TEST-FEED-V1_0" -H "System:EXAMPLE_SYSTEM" -H "Environment:EXAMPLE_ENVIRONMENT"
We will test a number of features as part of our installation test. These are
- simple post of data
- simple post of data to validate load balancing is working
- simple post to direct feed interface
- simple post to direct feed interface to validate load balancing is working
- identify that the Stroom Proxy Aggregation is working correctly
As part of our testing will check the presence of the inbound data, as files, within the proxy storage area.
Now as the proxy storage area is also the location from which the Stroom application
automatically aggregates then ingests the data stored by the proxy, we can either turn off the
Proxy Aggregation task,
or attempt to
perform our tests noting that proxy aggregation occurs every 10 minutes by default. For simplicity, we will
turn off the Proxy Aggregation task.
We can now perform out tests. Follow the steps in the Data Posting Tests section
of the Testing Stroom Installation HOWTO
Forwarding Stroom Proxy Deployment
In this deployment will install a Stroom Forwarding Proxy which is designed to aggregate data posted to it for managed forwarding to
a central Stroom processing system. This scenario is assuming we are installing on the fully patch Centos 7.3 host, stroomfp0.strmdev00.org.
Further it assumes we have installed, configured and tested the destination Stroom system we will be forwarding to.
We will first deploy the Stroom Proxy then configure it as a Forwarding Proxy then integrate a web service to run ‘in-front’ of
Proxy.
Prerequisite Software Installation for Forwarding Proxy
Certain software packages are required for the Stroom Proxy to run.
The core software list is
- java-1.8.0-openjdk
- java-1.8.0-openjdk-devel
- policycoreutils-python
- unzip
- zip
Most of the required software are packages available via standard repositories and hence we can simply execute
sudo yum -y install java-1.8.0-openjdk java-1.8.0-openjdk-devel policycoreutils-python unzip zip
Note that additional software will be required for other integration components (e.g. Apache httpd/mod_jk). This is
described in the
Web Service Integration for Forwarding Proxy
section of this document.
Forwarding Proxy Storage
Since we are a proxy that stores data sent to it and forwards it each minute we have only one directory.
/stroomdata/stroom-working-fp0/proxy - location for Stroom proxy to store inbound data files prior to forwarding
You will note that these HOWTOs use a consistent storage nomenclature for simplicity of documentations.
Creation of Storage for Forwarding Proxy
We create the processing user, as per
sudo useradd --system stroomuser
then create the storage hierarchy with the commands
sudo mkdir -p /stroomdata/stroom-working-fp0/proxy
sudo chown -R stroomuser:stroomuser /stroomdata
sudo chmod -R 750 /stroomdata
Stroom Forwarding Proxy Installation
Pre-installation setup
Before installing the Stroom Forwarding Proxy, we need establish various files and scripts within
the Stroom Processing user’s home directory to support the Stroom services and their persistence. This is setup is described
here. Although this setup HOWTO is orientated towards a complete Stroom Proxy
and Application installation, it does provide all the processing user setup requirements for a Stroom Proxy as well.
Stroom Forwarding Proxy Installation
Instructions for installation of the Stroom Proxy can be found here, noting you
should follow the steps for configuring the proxy as a Forwarding proxy.
Web Service Integration for Forwarding Proxy
One typically ‘fronts’ a Stroom Proxy with a secure web service such as Apache’s Httpd or NGINX.
In our scenario, we will use SSL to secure the web service and further, we will use Apache’s Httpd.
We first need to create certificates for use by the web service. The
SSL Certificate Generation HOWTO provides instructions for this.
The created certificates can then be used when configuration the web service. NOTE also, that for a forwarding
proxy we will need to establish Key and Trust stores as well. This is also documented in the SSL Certificate Generation HOWTO
here
This HOWTO is designed to deploy Apache’s httpd web service as a front end (https) (to the user) and
Apache’s mod_jk as the interface between Apache and the Stroom tomcat applications. The instructions
to configure this can be found here. Please take note of where a Stroom Proxy
configuration item is different to that of a Stroom Application processing node.
Other Web service capability can be used, for example, NGINX (external link).
Testing our Forwarding Proxy Installation
To complete the installation process we will test that we can send data to the forwarding proxy and that it forwards the files
it receives to the central Stroom processing system. As stated earlier, it is assumed we have installed, configured and tested the destination
central Stroom processing system and thus we will have a test Feed
already established - TEST-FEED-V1_0.
Sending Test Data
For this test, we will send the contents of /etc/group to our test feed - TEST-FEED-V1_0. It doesn’t matter from which host we send the file from.
The command to send file is
curl -k --data-binary @/etc/group "https://stroomfp0.strmdev00.org/stroom/datafeed" -H "Feed:TEST-FEED-V1_0" -H "System:EXAMPLE_SYSTEM" -H "Environment:EXAMPLE_ENVIRONMENT"
Before testing, it is recommended you set up to monitor the Stroom proxy logs on the central server as well as on the Forwarding Proxy server.
Follow the steps in the Forwarding Proxy Data Posting Tests section
of the Testing Stroom Installation HOWTO
Standalone Stroom Proxy Deployment
In this deployment will install a Stroom Standalone Proxy which is designed to accept and store data posted to it for manual forwarding to
a central Stroom processing system. This scenario is assuming we are installing on the fully patch Centos 7.3 host, stroomsap0.strmdev00.org.
We will first deploy the Stroom Proxy then configure it as a Standalone Proxy then integrate a web service to run ‘in-front’ of
Proxy.
Prerequisite Software Installation for Forwarding Proxy
Certain software packages are required for the Stroom Proxy to run.
The core software list is
- java-1.8.0-openjdk
- java-1.8.0-openjdk-devel
- policycoreutils-python
- unzip
- zip
Most of the required software are packages available via standard repositories and hence we can simply execute
sudo yum -y install java-1.8.0-openjdk java-1.8.0-openjdk-devel policycoreutils-python unzip zip
Note that additional software will be required for other integration components (e.g. Apache httpd/mod_jk). This is
described in the
Web Service Integration for Standalone Proxy
section of this document.
Standalone Proxy Storage
Since we are a proxy that stores data sent to it we have only one directory.
/stroomdata/stroom-working-sap0/proxy - location for Stroom proxy to store inbound data files
You will note that these HOWTOs use a consistent storage nomenclature for simplicity of documentations.
Creation of Storage for Standalone Proxy
We create the processing user, as per
sudo useradd --system stroomuser
then create the storage hierarchy with the commands
sudo mkdir -p /stroomdata/stroom-working-sap0/proxy
sudo chown -R stroomuser:stroomuser /stroomdata
sudo chmod -R 750 /stroomdata
Stroom Standalone Proxy Installation
Pre-installation setup
Before installing the Stroom Standalone Proxy, we need establish various files and scripts within
the Stroom Processing user’s home directory to support the Stroom services and their persistence. This is setup is described
here. Although this setup HOWTO is orientated towards a complete Stroom Proxy
and Application installation, it does provide all the processing user setup requirements for a Stroom Proxy as well.
Stroom Standalone Proxy Installation
Instructions for installation of the Stroom Proxy can be found here, noting you
should follow the steps for configuring the proxy as a Store_NoDB proxy.
Web Service Integration for Standalone Proxy
One typically ‘fronts’ a Stroom Proxy with a secure web service such as Apache’s Httpd or NGINX.
In our scenario, we will use SSL to secure the web service and further, we will use Apache’s Httpd.
We first need to create certificates for use by the web service. The
SSL Certificate Generation HOWTO provides instructions for this.
The created certificates can then be used when configuration the web service. There is no need for Trust or Key stores.
This HOWTO is designed to deploy Apache’s httpd web service as a front end (https) (to the user) and
Apache’s mod_jk as the interface between Apache and the Stroom tomcat applications. The instructions
to configure this can be found here. Please take note of where a Stroom Proxy
configuration item is different to that of a Stroom Application processing node.
Other Web service capability can be used, for example, NGINX (external link).
Testing our Standalone Proxy Installation
To complete the installation process we will test that we can send data to the standalone proxy and it stores it.
Sending Test Data
For this test, we will send the contents of /etc/group to our test feed - TEST-FEED-V1_0. It doesn’t matter from which host we send the file from.
The command to send file is
curl -k --data-binary @/etc/group "https://stroomsap0.strmdev00.org/stroom/datafeed" -H "Feed:TEST-FEED-V1_0" -H "System:EXAMPLE_SYSTEM" -H "Environment:EXAMPLE_ENVIRONMENT"
Before testing, it is recommended you set up to monitor the Standalone Proxy logs.
Follow the steps in the Standalone Proxy Data Posting Tests
section of the Testing Stroom Installation HOWTO
Addition of a Node to a Stroom Cluster Deployment
In this deployment we will deploy both the Stroom Proxy and Stroom Application software
to a new processing node we wish to add to our cluster. Once we have deploy and configured the Stroom software, we will then integrate a web
service to run ‘in-front’ of our Stroom software, and then perform the initial configuration of to add this node via the user interface. The
node we will add is stroomp02.strmdev00.org.
Grant access to the database for this node
Connect to the Stroom database as the administrative (root) user, via the command
sudo mysql --user=root -p
and at the MariaDB [(none)]> or mysql> prompt enter
grant all privileges on stroom.* to stroomuser@stroomp02.strmdev00.org identified by 'Stroompassword1@';
quit;
Prerequisite Software Installation
Certain software packages are required for either the Stroom Proxy or Stroom Application to run.
The core software list is
- java-1.8.0-openjdk
- java-1.8.0-openjdk-devel
- policycoreutils-python
- unzip
- zip
- mariadb or mysql client
Most of the required software are packages available via standard repositories and hence we can simply execute
sudo yum -y install java-1.8.0-openjdk java-1.8.0-openjdk-devel policycoreutils-python unzip zip
sudo yum -y install mariadb
In the above instance, the database client choice is MariaDB as it is directly supported by Centos 7. One could deploy the MySQL
database software as the alternative. If you have chosen a different database for the already deployed Stroom Cluster then you
should use that one. See earlier in this document on how to install the MySQL Community client.
Note that additional software will be required for other integration components (e.g. Apache httpd/mod_jk). This is
described in the Web Service Integration section of this document.
Storage Scenario
To maintain our Storage Scenario them, the scenario for this node is
- Node:
stroomp02.strmdev00.org
/stroomdata/stroom-data-p02 - location to store Stroom application data files (events, etc.) for this node/stroomdata/stroom-index-p02 - location to store Stroom application index files/stroomdata/stroom-working-p02 - location to store Stroom application working files (e.g. tmp, output, etc.) for this node/stroomdata/stroom-working-p02/proxy - location for Stroom proxy to store inbound data files
Creation of Storage Hierarchy
So, we first create processing user on our new node as per
sudo useradd --system stroomuser
then create the storage via
sudo mkdir -p /stroomdata/stroom-data-p02 /stroomdata/stroom-index-p02 /stroomdata/stroom-working-p02 /stroomdata/stroom-working-p02/proxy
sudo mkdir -p /stroomdata/stroom-data-p00  # So that this node can mount stroomp00's data directory
sudo mkdir -p /stroomdata/stroom-data-p01  # So that this node can mount stroomp01's data directory
sudo chown -R stroomuser:stroomuser /stroomdata
sudo chmod -R 750 /stroomdata
As we need to share this new nodes permanent data directories to the existing nodes in the Cluster, we need to
create mount point directories on our existing nodes in addition to deploying NFS.
So we execute on
- Node:
stroomp00.strmdev00.org
sudo mkdir -p /stroomdata/stroom-data-p02
sudo chmod 750 /stroomdata/stroom-data-p02
sudo chown stroomuser:stroomuser /stroomdata/stroom-data-p02
and on
- Node:
stroomp01.strmdev00.org
sudo mkdir -p /stroomdata/stroom-data-p02
sudo chmod 750 /stroomdata/stroom-data-p02
sudo chown stroomuser:stroomuser /stroomdata/stroom-data-p02
Deployment of NFS to share Stroom Storage
We will use NFS to cross mount the permanent data directories. That is
- node
stroomp00.strmdev00.org will mount
stroomp01.strmdev00.org:/stroomdata/stroom-data-p01 and,stroomp02.strmdev00.org:/stroomdata/stroom-data-p02 and,
- node
stroomp01.strmdev00.org will mount
stroomp00.strmdev00.org:/stroomdata/stroom-data-p00 andstroomp02.strmdev00.org:/stroomdata/stroom-data-p02
- node
stroomp02.strmdev00.org will mount
stroomp00.strmdev00.org:/stroomdata/stroom-data-p00 andstroomp01.strmdev00.org:/stroomdata/stroom-data-p01
The HOWTO guide to deploy and configure NFS for our Scenario is here.
Stroom Installation
Pre-installation setup
Before installing either the Stroom Proxy or Stroom Application, we need establish various files and scripts within
the Stroom Processing user’s home directory to support the Stroom services and their persistence. This is setup is described
here. Note you should remember to set the N bash variable
when generating the Environment Variable files to 02.
Stroom Proxy Installation
Instructions for installation of the Stroom Proxy can be found here. Note you
will be deploying a Store proxy and during the setup execution ensure you enter the appropriate values for NODE (‘stroomp02’)
and REPO_DIR (’/stroomdata/stroom-working-p02/proxy’). All other values will be the same.
Stroom Application Installation
Instructions for installation of the Stroom application can be found here.
When executing the setup script ensure you enter the appropriate values for TEMP_DIR (’/stroomdata/stroom-working-p02’) and NODE (‘stroomp02’).
All other values will be the same. Note also that you will not have to wait for the ‘first’ node to initialise the Stroom database as
this would have already been done when you first deployed your Stroom Cluster.
Web Service Integration
One typically ‘fronts’ either a Stroom Proxy or Stroom Application with a secure web service such as Apache’s Httpd or NGINX.
In our scenario, we will use SSL to secure the web service and further, we will use Apache’s Httpd.
As we are a cluster, we use the same certificate as the other nodes. Thus we need to gain the certificate package from an existing node.
So, on stroomp00.strmdev00.org, we replicate the directory ~stroomuser/stroom-jks to our new node. That is, tar it up, copy the tar file to
stroomp02 and untar it. We can make use of the other node’s mounted file system.
sudo -i -u stroomuser
cd ~stroomuser
tar cf stroom-jks.tar stroom-jks
mv stroom-jks.tar /stroomdata/stroom-data-p02
then on our new node (stroomp02.strmdev00.org) we extract the data.
sudo -i -u stroomuser
cd ~stroomuser
tar xf /stroomdata/stroom-data-p02/stroom-jks.tar && rm -f /stroomdata/stroom-data-p02/stroom-jks.tar
Now ensure protection, ownership and SELinux context for these files by running
chmod 700 ~stroomuser/stroom-jks/private ~stroomuser/stroom-jks
chown -R stroomuser:stroomuser ~stroomuser/stroom-jks
chcon -R --reference /etc/pki ~stroomuser/stroom-jks
This HOWTO is designed to deploy Apache’s httpd web service as a front end (https) (to the user) and
Apache’s mod_jk as the interface between Apache and the Stroom tomcat applications. The instructions
to configure this can be found here.
You should pay particular attention to the section on the
Apache Mod_JK configuration
as you MUST regenerate the Mod_JK workers.properties file on the existing cluster nodes as well as generating it on our new node.
Other Web service capability can be used, for example, NGINX (external link).
Note that once you have integrated the web services for our new node, you will need to restart the Apache systemd process on the existing
two nodes that that the new Mod_JK configuration has taken place.
Installation Validation
We will now check that the installation and web services integration has worked. We do this with a simple firewall check
and later perform complete integration tests.
Sanity firewall check
To ensure you have the firewall correctly set up, the following command
sudo firewall-cmd --reload
sudo firewall-cmd --zone=public --list-all
should result in
public (active)
  target: default
  icmp-block-inversion: no
  interfaces: enp0s3
  sources:
  services: dhcpv6-client http https nfs ssh
  ports: 8009/tcp 9080/tcp 8080/tcp 9009/tcp
  protocols:
  masquerade: no
  forward-ports:
  sourceports:
  icmp-blocks:
  rich rules:
Stroom Application Configuration - New Node
We will need to configure this new node’s volumes, set it’s Cluster URL and enable it’s Stream Processors.
We do this by logging into the Stroom User Interface (UI) with an account with Administrator privileges. It
is recommended you use a attributed user for this activity. Once you have logged in you can configure this
new node.
Before we can store data on this new Stroom node we need to configure it’s
volumes
we have allocated in our Storage hierarchy. The section on adding new volumes in the
Volume Maintenance HOWTO
shows how to do this.
In a Stroom cluster, nodes are expected to communicate with each other on port 8080 over http. Our
installation in a multi node environment ensures the firewall will allow this but we also need to
configure the new node. This is achieved via the Stroom UI where we set a Cluster URL for our node.
The section on Configuring a new node in the
Node Configuration HOWTO demonstrates how do
set the Cluster URL.
Data Stream Processing
To enable Stroom to process data, it’s
Data Processors
need to be enabled. There are NOT enabled by default on installation. The following
section
in our Stroom Tasks HowTo shows how to do this.
Testing our New Node Installation
To complete the installation process we will test that our new node has successfully integrated into our cluster.
First we need to ensure we have restarted the Apache Httpd service (httpd.service) on the original nodes so that the new workers.properties
configuration files take effect.
We now test the node integration by running the tests we use to validate a Multi Node Stroom Cluster Deployment found
here noting we should
monitor all three nodes proxy and application log files. Basically we are looking to see that this new node participates in the
load balancing for the stroomp.strmdev00.org cluster.
4.4 - Installation of Stroom Application
This HOWTO describes the installation and initial configuration of the Stroom Application.
Assumptions
- the user has reasonable RHEL/Centos System administration skills
- installation is on a fully patched minimal Centos 7.3 instance.
- the Stroom
stroom database has been created and resides on the host stroomdb0.strmdev00.org listening on port 3307.
- the Stroom
stroom database user is stroomuser with a password of Stroompassword1@.
- the Stroom
statistics database has been created and resides on the host stroomdb0.strmdev00.org listening on port 3308.
- the Stroom
statistics database user is stroomuser with a password of Stroompassword2@.
- the application user
stroomuser has been created
- the user is or has deployed the two node Stroom cluster described here
- the user has set up the Stroom processing user as described here
- the prerequisite software has been installed
- when a screen capture is documented, data entry is identified by the data surrounded by ‘<’ ‘>’ . This excludes enter/return presses.
Confirm Prerequisite Software Installation
The following command will ensure the prerequisite software has been deployed
sudo yum -y install java-1.8.0-openjdk java-1.8.0-openjdk-devel policycoreutils-python unzip zip
sudo yum -y install mariadb
or
sudo yum -y install mysql-community-client
Test Database connectivity
We need to test access to the Stroom databases on stroomdb0.strmdev00.org. We do this using the client mysql utility. We note that we
must enter the stroomuser user’s password set up in the creation of the database earlier (Stroompassword1@) when connecting to
the stroom database and we must enter the stroomstats user’s password (Stroompassword2@) when connecting to the statistics database.
We first test we can connect to the stroom database and then set the default database to be stroom.
[burn@stroomp00 ~]$ mysql --user=stroomuser --host=stroomdb0.strmdev00.org --port=3307 --password
Enter password: <__ Stroompassword1@ __>
Welcome to the MariaDB monitor.  Commands end with ; or \g.
Your MariaDB connection id is 2
Server version: 5.5.52-MariaDB MariaDB Server

Copyright (c) 2000, 2016, Oracle, MariaDB Corporation Ab and others.

Type 'help;' or '\h' for help. Type '\c' to clear the current input statement.

MariaDB [(none)]> use stroom;
Database changed
MariaDB [stroom]> exit
Bye
[burn@stroomp00 ~]$
In the case of a MySQL Community deployment you will see
[burn@stroomp00 ~]$ mysql --user=stroomuser --host=stroomdb0.strmdev00.org --port=3307 --password
Enter password: <__ Stroompassword1@ __>
Welcome to the MySQL monitor.  Commands end with ; or \g.
Your MySQL connection id is 9
Server version: 5.7.18 MySQL Community Server (GPL)

Copyright (c) 2000, 2017, Oracle and/or its affiliates. All rights reserved.

Oracle is a registered trademark of Oracle Corporation and/or its
affiliates. Other names may be trademarks of their respective
owners.

Type 'help;' or '\h' for help. Type '\c' to clear the current input statement.

mysql> use stroom;
Database changed
mysql> quit
Bye
[burn@stroomp00 ~]$
We next test connecting to the statistics database and verify we can set the default database to be statistics.
[burn@stroomp00 ~]$ mysql --user=stroomstats --host=stroomdb0.strmdev00.org --port=3308 --password
Enter password: <__ Stroompassword2@ __>
Welcome to the MariaDB monitor.  Commands end with ; or \g.
Your MariaDB connection id is 2
Server version: 5.5.52-MariaDB MariaDB Server

Copyright (c) 2000, 2016, Oracle, MariaDB Corporation Ab and others.

Type 'help;' or '\h' for help. Type '\c' to clear the current input statement.

MariaDB [(none)]> use statistics;
Database changed
MariaDB [stroom]> exit
Bye
[burn@stroomp00 ~]$
In the case of a MySQL Community deployment you will see
[burn@stroomp00 ~]$ mysql --user=stroomstats --host=stroomdb0.strmdev00.org --port=3308 --password
Enter password:  <__ Stroompassword2@ __>
Welcome to the MySQL monitor.  Commands end with ; or \g.
Your MySQL connection id is 9
Server version: 5.7.18 MySQL Community Server (GPL)

Copyright (c) 2000, 2017, Oracle and/or its affiliates. All rights reserved.

Oracle is a registered trademark of Oracle Corporation and/or its
affiliates. Other names may be trademarks of their respective
owners.

Type 'help;' or '\h' for help. Type '\c' to clear the current input statement.

mysql> use statistics;
Database changed
mysql> quit
Bye
[burn@stroomp00 ~]$
If there are any errors, correct them.
Get the Software
The following will gain the identified, in this case release 5.0-beta.18, Stroom Application software release from github, then deploy it. You should regularly monitor the site for newer releases.
sudo -i -u stroomuser
App=5.0-beta.18
wget https://github.com/gchq/stroom/releases/download/v${App}/stroom-app-distribution-${App}-bin.zip
unzip stroom-app-distribution-${App}-bin.zip
chmod 750 stroom-app
We install the application via
stroom-app/bin/setup.sh
during which one is prompted for a number of configuration settings. Use the following
TEMP_DIR should be set to '/stroomdata/stroom-working-p00' or '/stroomdata/stroom-working-p01' etc depending on the node we are installing on
NODE to be the hostname (not FQDN) of your host (i.e. 'stroomp00' or 'stroomp01' in our multi node scenario)
RACK can be ignored, just press return
PORT_PREFIX should use the default, just press return
JDBC_CLASSNAME should use the default, just press return
JDBC_URL to 'jdbc:mysql://stroomdb0.strmdev00.org:3307/stroom?useUnicode=yes&characterEncoding=UTF-8'
DB_USERNAME should be our processing user, 'stroomuser'
DB_PASSWORD should be the one we set when creating the stroom database, that is 'Stroompassword1@'
JPA_DIALECT should use the default, just press return
JAVA_OPTS can use the defaults, but ensure you have sufficient memory, either change or accept the default
STROOM_STATISTICS_SQL_JDBC_CLASSNAME should use the default, just press return
STROOM_STATISTICS_SQL_JDBC_URL to 'jdbc:mysql://stroomdb0.strmdev00.org:3308/statistics?useUnicode=yes&characterEncoding=UTF-8'
STROOM_STATISTICS_SQL_DB_USERNAME should be our processing user, 'stroomstats'
STROOM_STATISTICS_SQL_DB_PASSWORD should be the one we set when creating the stroom database, that is 'Stroompassword2@'
STATS_ENGINES should use the default, just press return
CONTENT_PACK_IMPORT_ENABLED should use the default, just press return
CREATE_DEFAULT_VOLUME_ON_START should use the default, just press return
At this point, the script will configure the application. There should be no errors, but review the output.
If you made an error then just re-run the script.
You will note that TEMP_DIR is the same directory we used for our STROOM_TMP environment variable when we set up the processing user scripts.
Note that if you are deploying a single node environment, where the database is also running on your Stroom node, then the JDBC_URL setting can be the default.
Start the Application service
Now we start the application. In the case of multi node Stroom deployment, we start the Stroom application on the first node in the cluster,
then wait until it has initialised the database commenced it’s Lifecycle task. You will need to monitor the log file to see it’s
completed initialisation.
So as the stroomuser start the application with the command
stroom-app/bin/start.sh
Now monitor stroom-app/instance/logs for any errors. Initially you will see the log files localhost_access_log.YYYY-MM-DD.txt
and catalina.out. Check them for errors and correct (or post a question). The log4j warnings in catalina.out can be ignored.
Eventually the log file stroom-app/instance/logs/stroom.log will appear. Again check it for errors and then wait for the application to
be initialised. That is, wait for the Lifecycle service thread to start. This is indicated by the message
INFO [Thread-11] lifecycle.LifecycleServiceImpl (LifecycleServiceImpl.java:166) - Started Stroom Lifecycle service
The directory stroom-app/instance/logs/events will also appear with an empty file with
the nomenclature events_YYYY-MM-DDThh:mm:ss.msecZ. This is the directory for storing Stroom’s application event logs. We will return to this
directory and it’s content in a later HOWTO.
If you have a multi node configuration, then once the database has initialised, start the application service on all other nodes. Again with
stroom-app/bin/start.sh
and then monitor the files in its stroom-app/instance/logs for any errors. Note that in multi node configurations,
you will see server.UpdateClusterStateTaskHandler messages in the log file of the form
WARN [Stroom P2 #9 - GenericServerTask] server.UpdateClusterStateTaskHandler (UpdateClusterStateTaskHandler.java:150) - discover() - unable to contact stroomp00 - No cluster call URL has been set for node: stroomp00
This is ok as we will establish the cluster URL’s later.
Multi Node Firewall Provision
In the case of a multi node Stroom deployment, you will need to open certain ports to allow Tomcat to communicate to all nodes participating
in the cluster. Execute the following on all nodes. Note you will need to drop out of the stroomuser shell prior to execution.
exit; # To drop out of the stroomuser shell

sudo firewall-cmd --zone=public --add-port=8080/tcp --permanent
sudo firewall-cmd --zone=public --add-port=9080/tcp --permanent
sudo firewall-cmd --zone=public --add-port=8009/tcp --permanent
sudo firewall-cmd --zone=public --add-port=9009/tcp --permanent
sudo firewall-cmd --reload
sudo firewall-cmd --zone=public --list-all
In a production environment you would improve the above firewall settings - to perhaps limit the communication to just the Stroom processing nodes.
4.5 - Installation of Stroom Proxy
This HOWTO describes the installation and configuration of the Stroom Proxy software.
Assumptions
The following assumptions are used in this document.
- the user has reasonable RHEL/Centos System administration skills.
- installation is on a fully patched minimal Centos 7.3 instance.
- the Stroom database has been created and resides on the host
stroomdb0.strmdev00.org listening on port 3307.
- the Stroom database user is
stroomuser with a password of Stroompassword1@.
- the application user
stroomuser has been created.
- the user is or has deployed the two node Stroom cluster described here.
- the user has set up the Stroom processing user as described here.
- the prerequisite software has been installed.
- when a screen capture is documented, data entry is identified by the data surrounded by ‘<’ ‘>’ . This excludes enter/return presses.
Confirm Prerequisite Software Installation
The following command will ensure the prerequisite software has been deployed
sudo yum -y install java-1.8.0-openjdk java-1.8.0-openjdk-devel policycoreutils-python unzip zip
sudo yum -y install mariadb
or
sudo yum -y install mysql-community-client
Note that we do NOT need the database client software for a Forwarding or Standalone proxy.
Get the Software
The following will gain the identified, in this case release 5.1-beta.10, Stroom Application software release from github, then deploy it. You should regularly monitor the site for newer releases.
sudo -i -u stroomuser
Prx=v5.1-beta.10
wget https://github.com/gchq/stroom-proxy/releases/download/${Prx}/stroom-proxy-distribution-${Prx}.zip
unzip stroom-proxy-distribution-${Prx}.zip
There are three different types of Stroom Proxy
A store proxy accepts batches of events, as files. It will validate the batch with the database then store the batches as files in a configured directory.
A store_nodb proxy accepts batches of events, as files. It has no connectivity to the database, so it assumes all batches are valid, so it stores the batches as files in a configured directory.
A forwarding proxy accepts batches of events, as files. It has indirect connectivity to the database via the destination proxy, so it validates the batches then stores the batches as files in a configured directory until they are periodically forwarded to the configured destination Stroom proxy.
We will demonstrate the installation of each.
Store Proxy Configuration
In our Store Proxy description below, we will use the multi node deployment scenario. That is we are deploying the Store proxy on multiple Stroom nodes (stroomp00, stroomp01) and we have configured our storage as per the Storage Scenario which means the directories to install the inbound batches of data are /stroomdata/stroom-working-p00/proxy and /stroomdata/stroom-working-p01/proxy depending on the node.
To install a Store proxy, we run
stroom-proxy/bin/setup.sh store
during which one is prompted for a number of configuration settings. Use the following
NODE to be the hostname (not FQDN) of your host (i.e. 'stroomp00' or 'stroomp01' depending on the node we are installing on)
PORT_PREFIX should use the default, just press return
REPO_DIR should be set to '/stroomdata/stroom-working-p00/proxy' or '/stroomdata/stroom-working-p01/proxy' depending on the node we are installing on
REPO_FORMAT can be left as the default, just press return
JDBC_CLASSNAME should use the default, just press return
JDBC_URL should be set to 'jdbc:mysql://stroomdb0.strmdev00.org:3307/stroom'
DB_USERNAME should be our processing user, 'stroomuser'
DB_PASSWORD should be the one we set when creating the stroom database, that is 'Stroompassword1@'
JAVA_OPTS can use the defaults, but ensure you have sufficient memory, either change or accept the default
At this point, the script will configure the proxy. There should be no errors, but review the output.
If you make a mistake in the above, just re-run the script.
NOTE: The selection of the REPO_DIR above and the setting of the STROOM_TMP environment variable earlier ensure that not only inbound files are placed in the REPO_DIR location but the Stroom Application itself will access the same directory when it aggregates inbound data for ingest in it’s proxy aggregation threads.
Forwarding Proxy Configuration
In our Forwarding Proxy description below, we will deploy on a host named stroomfp0 and it will store the files in /stroomdata/stroom-working-fp0/proxy. Remember, we are being consistent with our Storage hierarchy to make documentation and scripting simpler. Our destination host to periodically forward the files to will be stroomp.strmdev00.org (the CNAME for stroomp00.strmdev00.org).
To install a Forwarding proxy, we run
stroom-proxy/bin/setup.sh forward
during which one is prompted for a number of configuration settings. Use the following
NODE to be the hostname (not FQDN) of your host (i.e. 'stroomfp0' in our example)
PORT_PREFIX should use the default, just press return
REPO_DIR should be set to '/stroomdata/stroom-working-fp0/proxy' which we created earlier.
REPO_FORMAT can be left as the default, just press return
FORWARD_SERVER should be set to our stroom server. (i.e. 'stroomp.strmdev00.org' in our example)
JAVA_OPTS can use the defaults, but ensure you have sufficient memory, either change or accept the default
At this point, the script will configure the proxy. There should be no errors, but review the output.
Store No Database Proxy Configuration
In our Store_NoDB Proxy description below, we will deploy on a host named stroomsap0 and it will store the files in /stroomdata/stroom-working-sap0/proxy. Remember, we are being consistent with our Storage hierarchy to make documentation and scripting simpler.
To install a Store_NoDB proxy, we run
stroom-proxy/bin/setup.sh store_nodb
during which one is prompted for a number of configuration settings. Use the following
NODE to be the hostname (not FQDN) of your host (i.e. 'stroomsap0' in our example)
PORT_PREFIX should use the default, just press return
REPO_DIR should be set to '/stroomdata/stroom-working-sap0/proxy' which we created earlier.
REPO_FORMAT can be left as the default, just press return
JAVA_OPTS can use the defaults, but ensure you have sufficient memory, either change or accept the default
At this point, the script will configure the proxy. There should be no errors, but review the output.
Apache/Mod_JK change
For all proxy deployments, if we are using Apache’s mod_jk then we need to ensure the proxy’s AJP connector specifies a 64K packetSize. View the file stroom-proxy/instance/conf/server.xml to ensure the Connector element for the AJP protocol has a packetSize attribute of 65536. For example,
grep AJP stroom-proxy/instance/conf/server.xml
shows
<Connector port="9009" protocol="AJP/1.3" connectionTimeout="20000" redirectPort="8443" maxThreads="200" packetSize="65536" />
This check is required for earlier releases of the Stroom Proxy. Releases since v5.1-beta.4 have set the AJP packetSize.
Start the Proxy Service
We can now manually start our proxy service. Do so as the stroomuser with the command
stroom-proxy/bin/start.sh
Now monitor the directory stroom-proxy/instance/logs for any errors. Initially you will see the log files localhost_access_log.YYYY-MM-DD.txt and catalina.out. Check them for errors and correct (or pose a question to this arena).
The context path and unknown version warnings in catalina.out can be ignored.
Eventually (about 60 seconds) the log file stroom-proxy/instance/logs/stroom.log will appear. Again check it for errors.
The proxy will have completely started when you see the messages
INFO [localhost-startStop-1] spring.StroomBeanLifeCycleReloadableContextBeanProcessor (StroomBeanLifeCycleReloadableContextBeanProcessor.java:109) - ** proxyContext 0 START COMPLETE **
and
INFO [localhost-startStop-1] spring.StroomBeanLifeCycleReloadableContextBeanProcessor (StroomBeanLifeCycleReloadableContextBeanProcessor.java:109) - ** webContext 0 START COMPLETE **
If you leave it for a while you will eventually see cyclic (10 minute cycle) messages of the form
INFO [Repository Reader Thread 1] repo.ProxyRepositoryReader (ProxyRepositoryReader.java:170) - run() - Cron Match at YYYY-MM-DD ...
If a proxy takes too long to start, you should read the section on Entropy Issues.
A Stroom Proxy stores inbound files in a hierarchical file system whose root is supplied during the proxy setup (REPO_DIR) and as files arrive they are given a repository id that is a one-up number starting at one (1). The files are stored in a specific repository format.
The default template is ${pathId}/${id} and this pattern will produce the following output files under REPO_DIR for the given repository id
| Repository Id |
FilePath |
| 1 |
000.zip |
| 100 |
100.zip |
| 1000 |
001/001000.zip |
| 10000 |
010/010000.zip |
| 100000 |
100/100000.zip |
Since version v5.1-beta.4, this template can be specified during proxy setup via the entry to the Stroom Proxy Repository Format prompt
...
@@REPO_FORMAT@@ : Stroom Proxy Repository Format [${pathId}/${id}] >
...
The template uses replacement variables to form the file path. As indicated above, the default template is ${pathId}/${id} where ${pathId} is the automatically generated directory for a given repository id and ${id} is the repository id.
Other replacement variables can be used to in the template including http header meta data parameters (e.g. ‘${feed}’) and time based parameters (e.g. ‘${year}’). Replacement variables that cannot be resolved will be output as ‘_’. You must ensure that all templates include the ‘${id}’ replacement variable at the start of the file name, failure to do this will result in an invalid repository.
Available time based parameters are based on the file’s time of processing and are zero filled (excluding ms).
| Parameter |
Description |
| year |
four digit year |
| month |
two digit month |
| day |
two digit day |
| hour |
two digit hour |
| minute |
two digit minute |
| second |
two digit second |
| millis |
three digit milliseconds value |
| ms |
milliseconds since Epoch value |
Proxy Repository Template Examples
For each of the following templates applied to a Store NoDB Proxy, the resultant proxy directory tree is shown after three posts were sent to the test feed TEST-FEED-V1_0 and two posts to the test feed FEED-NOVALUE-V9_0
Example A - The default - ${pathId}/${id}
[stroomuser@stroomsap0 ~]$ find /stroomdata/stroom-working-sap0/proxy/
/stroomdata/stroom-working-sap0/proxy/
/stroomdata/stroom-working-sap0/proxy/001.zip
/stroomdata/stroom-working-sap0/proxy/002.zip
/stroomdata/stroom-working-sap0/proxy/003.zip
/stroomdata/stroom-working-sap0/proxy/004.zip
/stroomdata/stroom-working-sap0/proxy/005.zip
[stroomuser@stroomsap0 ~]$
Example B - A feed orientated structure - ${feed}/${year}/${month}/${day}/${pathId}/${id}
[stroomuser@stroomsap0 ~]$ find /stroomdata/stroom-working-sap0/proxy/
/stroomdata/stroom-working-sap0/proxy/
/stroomdata/stroom-working-sap0/proxy/TEST-FEED-V1_0
/stroomdata/stroom-working-sap0/proxy/TEST-FEED-V1_0/2017
/stroomdata/stroom-working-sap0/proxy/TEST-FEED-V1_0/2017/07
/stroomdata/stroom-working-sap0/proxy/TEST-FEED-V1_0/2017/07/23
/stroomdata/stroom-working-sap0/proxy/TEST-FEED-V1_0/2017/07/23/001.zip
/stroomdata/stroom-working-sap0/proxy/TEST-FEED-V1_0/2017/07/23/002.zip
/stroomdata/stroom-working-sap0/proxy/TEST-FEED-V1_0/2017/07/23/003.zip
/stroomdata/stroom-working-sap0/proxy/FEED-NOVALUE-V9_0
/stroomdata/stroom-working-sap0/proxy/FEED-NOVALUE-V9_0/2017
/stroomdata/stroom-working-sap0/proxy/FEED-NOVALUE-V9_0/2017/07
/stroomdata/stroom-working-sap0/proxy/FEED-NOVALUE-V9_0/2017/07/23
/stroomdata/stroom-working-sap0/proxy/FEED-NOVALUE-V9_0/2017/07/23/004.zip
/stroomdata/stroom-working-sap0/proxy/FEED-NOVALUE-V9_0/2017/07/23/005.zip
[stroomuser@stroomsap0 ~]$
Example C - A date orientated structure - ${year}/${month}/${day}/${pathId}/${id}
[stroomuser@stroomsap0 ~]$ find /stroomdata/stroom-working-sap0/proxy/
/stroomdata/stroom-working-sap0/proxy/
/stroomdata/stroom-working-sap0/proxy/2017
/stroomdata/stroom-working-sap0/proxy/2017/07
/stroomdata/stroom-working-sap0/proxy/2017/07/23
/stroomdata/stroom-working-sap0/proxy/2017/07/23/001.zip
/stroomdata/stroom-working-sap0/proxy/2017/07/23/002.zip
/stroomdata/stroom-working-sap0/proxy/2017/07/23/003.zip
/stroomdata/stroom-working-sap0/proxy/2017/07/23/004.zip
/stroomdata/stroom-working-sap0/proxy/2017/07/23/005.zip
[stroomuser@stroomsap0 ~]$
Example D - A feed orientated structure, but with a bad parameter - ${feed}/${badparam}/${day}/${pathId}/${id}
[stroomuser@stroomsap0 ~]$ find /stroomdata/stroom-working-sap0/proxy/
/stroomdata/stroom-working-sap0/proxy/
/stroomdata/stroom-working-sap0/proxy/TEST-FEED-V1_0
/stroomdata/stroom-working-sap0/proxy/TEST-FEED-V1_0/_
/stroomdata/stroom-working-sap0/proxy/TEST-FEED-V1_0/_/23
/stroomdata/stroom-working-sap0/proxy/TEST-FEED-V1_0/_/23/001.zip
/stroomdata/stroom-working-sap0/proxy/TEST-FEED-V1_0/_/23/002.zip
/stroomdata/stroom-working-sap0/proxy/TEST-FEED-V1_0/_/23/003.zip
/stroomdata/stroom-working-sap0/proxy/FEED-NOVALUE-V9_0
/stroomdata/stroom-working-sap0/proxy/FEED-NOVALUE-V9_0/_
/stroomdata/stroom-working-sap0/proxy/FEED-NOVALUE-V9_0/_/23
/stroomdata/stroom-working-sap0/proxy/FEED-NOVALUE-V9_0/_/23/004.zip
/stroomdata/stroom-working-sap0/proxy/FEED-NOVALUE-V9_0/_/23/005.zip
[stroomuser@stroomsap0 ~]$
and one would also see a warning for each post in the proxy’s log file of the form
WARN [ajp-apr-9009-exec-4] repo.StroomFileNameUtil (StroomFileNameUtil.java:133) - Unused variables found: [badparam]
4.6 - NFS Installation and Configuration
The following is a HOWTO to assist users in the installation and set up of NFS to support the sharing of directories in a two node Stroom cluster or add a new node to an existing cluster.
Assumptions
The following assumptions are used in this document.
- the user has reasonable RHEL/Centos System administration skills
- installations are on Centos 7.3 minimal systems (fully patched)
- the user is or has deployed the example two node Stroom cluster storage hierarchy described here
- the configuration of this NFS is NOT secure. It is highly recommended to improve it’s security in a production environment. This could include improved firewall configuration to limit NFS access, NFS4 with Kerberos etc.
Installation of NFS software
We install NFS on each node, via
sudo yum -y install nfs-utils
and enable the relevant services, via
sudo systemctl enable rpcbind
sudo systemctl enable nfs-server
sudo systemctl enable nfs-lock
sudo systemctl enable nfs-idmap
sudo systemctl start rpcbind
sudo systemctl start nfs-server
sudo systemctl start nfs-lock
sudo systemctl start nfs-idmap
Configuration of NFS exports
We now export the node’s /stroomdata directory (in case you want to share the working directories) by configuring /etc/exports. For simplicity sake, we will allow all nodes with the hostname nomenclature of stroomp*.strmdev00.org to mount the /stroomdata directory. This means the same configuration applies to all nodes.
# Share Stroom data directory
/stroomdata	stroomp*.strmdev00.org(rw,sync,no_root_squash)
This can be achieved with the following on both nodes
sudo su -c "printf '# Share Stroom data directory\n' >> /etc/exports"
sudo su -c "printf '/stroomdata\tstroomp*.strmdev00.org(rw,sync,no_root_squash)\n' >> /etc/exports"
On both nodes restart the NFS service to ensure the above export takes effect via
sudo systemctl restart nfs-server
So that our nodes can offer their filesystems, we need to enable NFS access on the firewall.
This is done via
sudo firewall-cmd --zone=public --add-service=nfs --permanent
sudo firewall-cmd --reload
sudo firewall-cmd --zone=public --list-all
Test Mounting
You should do test mounts on each node.
- Node:
stroomp00.strmdev00.org
sudo mount -t nfs4 stroomp01.strmdev00.org:/stroomdata/stroom-data-p01 /stroomdata/stroom-data-p01
- Node:
stroomp01.strmdev00.org
sudo mount -t nfs4 stroomp00.strmdev00.org:/stroomdata/stroom-data-p00 /stroomdata/stroom-data-p00
If you are concerned you can’t see the mount with a df try a df --type=nfs4 -a or a sudo df. Irrespective, once the mounting works, make the mounts permanent by adding the following to each node’s /etc/fstab file.
- Node:
stroomp00.strmdev00.org
stroomp01.strmdev00.org:/stroomdata/stroom-data-p01 /stroomdata/stroom-data-p01 nfs4 soft,bg
achieved with
sudo su -c "printf 'stroomp01.strmdev00.org:/stroomdata/stroom-data-p01 /stroomdata/stroom-data-p01 nfs4 soft,bg\n' >> /etc/fstab"
- Node:
stroomp01.strmdev00.org
stroomp00.strmdev00.org:/stroomdata/stroom-data-p00 /stroomdata/stroom-data-p00 nfs4 soft,bg
achieved with
sudo su -c "printf 'stroomp00.strmdev00.org:/stroomdata/stroom-data-p00 /stroomdata/stroom-data-p00 nfs4 soft,bg\n' >> /etc/fstab"
At this point reboot all processing nodes to ensure the directories mount automatically. You may need to give the nodes a minute to do this.
Addition of another Node
If one needs to add another node to the cluster, lets say, stroomp02.strmdev00.org, on which /stroomdata follows the same storage hierarchy
as the existing nodes and all nodes have added mount points (directories) for this new node, you would take the following steps in order.
sudo su -c "printf '# Share Stroom data directory\n' >> /etc/exports"
sudo su -c "printf '/stroomdata\tstroomp*.strmdev00.org(rw,sync,no_root_squash)\n' >> /etc/exports"
- Restart the NFS service and make the firewall enable NFS access as per
sudo systemctl restart nfs-server
sudo firewall-cmd --zone=public --add-service=nfs --permanent
sudo firewall-cmd --reload
sudo firewall-cmd --zone=public --list-all
- Test mount the existing node file systems
sudo mount -t nfs4 stroomp00.strmdev00.org:/stroomdata/stroom-data-p00 /stroomdata/stroom-data-p00
sudo mount -t nfs4 stroomp01.strmdev00.org:/stroomdata/stroom-data-p01 /stroomdata/stroom-data-p01
- Once the test mounts work, we make them permanent by adding the following to the /etc/fstab file.
stroomp00.strmdev00.org:/home/stroomdata/stroom-data-p00 /home/stroomdata/stroom-data-p00 nfs4 soft,bg
stroomp01.strmdev00.org:/home/stroomdata/stroom-data-p01 /home/stroomdata/stroom-data-p01 nfs4 soft,bg
achieved with
sudo su -c "printf 'stroomp00.strmdev00.org:/stroomdata/stroom-data-p00 /stroomdata/stroom-data-p00 nfs4 soft,bg\n' >> /etc/fstab"
sudo su -c "printf 'stroomp01.strmdev00.org:/stroomdata/stroom-data-p01 /stroomdata/stroom-data-p01 nfs4 soft,bg\n' >> /etc/fstab"
sudo mount -t nfs4 stroomp02.strmdev00.org:/stroomdata/stroom-data-p02 /stroomdata/stroom-data-p02
- Once the test mount works, make the mount permanent by adding the following to the /etc/fstab file
stroomp02.strmdev00.org:/stroomdata/stroom-data-p02 /stroomdata/stroom-data-p02 nfs4 soft,bg
achieved with
sudo su -c "printf 'stroomp02.strmdev00.org:/stroomdata/stroom-data-p02 /stroomdata/stroom-data-p02 nfs4 soft,bg\n' >> /etc/fstab"
4.7 - Node Cluster URL Setup
Configuring Stroom cluster URLs
In a Stroom cluster, Nodes are expected to communicate with each other on port 8080 over http. To facilitate this, we need to set each node’s Cluster URL and the following demonstrates this process.
Assumptions
- an account with the
Administrator Application Permission is currently logged in.
- we have a multi node Stroom cluster with two nodes,
stroomp00 and stroomp01
- appropriate firewall configurations have been made
- in the scenario of adding a new node to our multi node deployment, the node added will be
stroomp02
To configure the nodes, move to the Monitoring item of the Main Menu and select it to bring up the Monitoring sub-menu.
then move down and select the Nodes sub-item to be presented with the Nodes configuration tab as seen below.
To set stroomp00’s Cluster URL, move the it’s line in the display and select it. It will be highlighted.
Then move the cursor to the Edit Node icon
 in the top left of
the
 Nodes tab and select it. On selection the Edit Node configuration window will be displayed and into
the Cluster URL: entry box, enter the first node’s URL of http://stroomp00.strmdev00.org:8080/stroom/clustercall.rpc
then press the
Ok
at which we see the Cluster URL has been set for the first node as per
We next select the second node
then move the cursor to the Edit Node icon
 in the top left of
the
 Nodes tab and select it. On selection the Edit Node configuration window will be displayed and into
the Cluster URL: entry box, enter the second node’s URL of http://stroomp01.strmdev00.org:8080/stroom/clustercall.rpc
then press the
Ok
button.
At this we will see both nodes have the Cluster URLs set.
.
You may need to press the Refresh icon
 found at top left of
 Nodes configuration tab, until both nodes show healthy pings.
.
If you do not get ping results for each node, then they are not configured correctly. In that situation,
review all log files and processes that you have performed.
Once you have set the Cluster URLs of each node you should also set the master assignment priority for each node to
be different to all of the others. In the image above both have been assigned equal priority - 1. We will
change stroomp00 to have a different priority - 3. You should note that the node with the highest
priority gains the Master node status.
.
When one expands a Multi Node Stroom cluster deployment, after the installation of the Stroom Proxy and Application software and services on
the new node, one has to configure the new node’s Cluster URL.
To configure the new node, move to the Monitoring item of the Main Menu and select it to bring up the Monitoring sub-menu.
then move down and select the Nodes sub-item to be presented with the Nodes configuration tab as seen below.
To set stroomp02’s Cluster URL, move the it’s line in the display and select it. It will be highlighted.
Then move the cursor to the Edit Node icon
 in the top left
of the
 Nodes tab and select it. On selection the Edit Node configuration window will be displayed
and into the Cluster URL: entry box, enter the first node’s URL of http://stroomp02.strmdev00.org:8080/stroom/clustercall.rpc
then press the
Ok
button at which we see the Cluster URL has been set for the first node as per
You need to press the Refresh icon
 found at top left of
 Nodes configuration tab, until the new node shows a healthy ping.
.
If you do not get a ping results for the new node, then it is not configured correctly. In that situation, review all log files
and processes that you have performed.
Once you have set the Cluster URL you should also set the master assignment priority for each node to
be different to all of the others. In the image above both stroomp01 and the new node, stroomp02, have been
assigned equal priority - 1. We will change stroomp01 to have a different priority - 2. You should note that the node
with the highest priority maintains the Master node status.
.
4.8 - Processing User setup
This HOWTO demonstrates how to set up various files and scripts that the Stroom processing user requires.
Assumptions
- the user has reasonable RHEL/Centos System administration skills
- installation is on a fully patched minimal Centos 7.3 instance.
- the application user
stroomuser has been created
- the user is deploying for either
- the example two node Stroom cluster whose storage is described here
- a simple Forwarding or Standalone Proxy
- adding a node to an existing Stroom cluster
Set up the Stroom processing user’s environment
To automate the running of a Stroom Proxy or Application service under out Stroom processing user, stroomuser, there are a number of configuration files and scripts we need to deploy.
We first become the stroomuser
sudo -i -u stroomuser
Environment Variable files
When either a Stroom Proxy or Application starts, it needs predefined environment variables. We set these up in the stroomuser home directory.
We need two files for this. The first is for the Stroom processes themselves and the second is for the Stroom systemd service we deploy. The
difference is that for the Stroom processes, we need to export the environment variables where as the Stroom systemd service file just needs to read them.
The JAVA_HOME and PATH variables are to support Java running the Tomcat instances.
The STROOM_TMP variable is set to a working area for the Stroom Application to use. The application accesses this environment variable internally
via the ${stroom_tmp} context variable. Note that we only need the STROOM_TMP variable for Stroom Application deployments, so one
could remove it from the files for a Forwarding or Standalone proxy deployment.
With respect to the working area, we will make use of the Storage Scenario we have defined and hence use the directory /stroomdata/stroom-working-p_nn_ where nn is the hostname node number (i.e 00 for host stroomp00, 01 for host stroomp01, etc).
So, for the first node, 00, we run
N=00
F=~/env.sh
printf '# Environment variables for Stroom services\n' > ${F}
printf 'export JAVA_HOME=/usr/lib/jvm/java-1.8.0\n' >> ${F}
printf 'export PATH=${JAVA_HOME}/bin:${PATH}\n' >> ${F}
printf 'export STROOM_TMP=/stroomdata/stroom-working-p%s\n' ${N} >> ${F}
chmod 640 ${F}

F=~/env_service.sh
printf '# Environment variables for Stroom services, executed out of systemd service\n' > ${F}
printf 'JAVA_HOME=/usr/lib/jvm/java-1.8.0\n' >> ${F}
printf 'PATH=${JAVA_HOME}/bin:${PATH}\n' >> ${F}
printf 'STROOM_TMP=/stroomdata/stroom-working-p%s\n' ${N} >> ${F}
chmod 640 ${F}
then we can change the N variable on each successive node and run the above.
Alternately, for a Stroom Forwarding or Standalone proxy, the following would be sufficient
F=~/env.sh
printf '# Environment variables for Stroom services\n' > ${F}
printf 'export JAVA_HOME=/usr/lib/jvm/java-1.8.0\n' >> ${F}
printf 'export PATH=${JAVA_HOME}/bin:${PATH}\n' >> ${F}
chmod 640 ${F}

F=~/env_service.sh
printf '# Environment variables for Stroom services, executed out of systemd service\n' > ${F}
printf 'JAVA_HOME=/usr/lib/jvm/java-1.8.0\n' >> ${F}
printf 'PATH=${JAVA_HOME}/bin:${PATH}\n' >> ${F}
chmod 640 ${F}
And we integrate the environment into our bash instantiation script as well as setting up useful bash functions. This is the same for all nodes.
Note that the T and Tp aliases are always installed whether they are of use of not. IE a Standalone or Forwarding Stroom Proxy could make
no use of the T shell alias.
F=~/.bashrc
printf '. ~/env.sh\n\n' >> ${F}
printf '# Simple functions to support Stroom\n' >> ${F}
printf '# T - continually monitor (tail) the Stroom application log\n'  >> ${F}
printf '# Tp - continually monitor (tail) the Stroom proxy log\n'  >> ${F}
printf 'function T {\n  tail --follow=name ~/stroom-app/instance/logs/stroom.log\n}\n' >> ${F}
printf 'function Tp {\n  tail --follow=name ~/stroom-proxy/instance/logs/stroom.log\n}\n' >> ${F}
And test it has set up correctly
. ./.bashrc
which java
which should return /usr/lib/jvm/java-1.8.0/bin/java
Establish Simple Start/Stop Scripts
We create some simple start/stop scripts that start, or stop, all the available Stroom services. At this point, it’s just the Stroom application and proxy.
if [ ! -d ~/bin ]; then mkdir ~/bin; fi
F=~/bin/StartServices.sh
printf '#!/bin/bash\n' > ${F}
printf '# Start all Stroom services\n' >> ${F}
printf '# Set list of services\n' >> ${F}
printf 'Services="stroom-proxy stroom-app"\n' >> ${F}
printf 'for service in ${Services}; do\n' >> ${F}
printf '  if [ -f ${service}/bin/start.sh ]; then\n' >> ${F}
printf '    bash ${service}/bin/start.sh\n' >> ${F}
printf '  fi\n' >> ${F}
printf 'done\n' >> ${F}
chmod 750 ${F}

F=~/bin/StopServices.sh
printf '#!/bin/bash\n' > ${F}
printf '# Stop all Stroom services\n' >> ${F}
printf '# Set list of services\n' >> ${F}
printf 'Services="stroom-proxy stroom-app"\n' >> ${F}
printf 'for service in ${Services}; do\n' >> ${F}
printf '  if [ -f ${service}/bin/stop.sh ]; then\n' >> ${F}
printf '    bash ${service}/bin/stop.sh\n' >> ${F}
printf '  fi\n' >> ${F}
printf 'done\n' >> ${F}
chmod 750 ${F}
Although one can modify the above for Stroom Forwarding or Standalone Proxy deployments, there is no issue if you use the same scripts.
Establish and Deploy Systemd services
Processing or Proxy node
For a standard Stroom Processing or Proxy nodes, we can use the following service script.
(Noting this is done as root)
sudo bash
F=/etc/systemd/system/stroom-services.service
printf '# Install in /etc/systemd/system\n' > ${F}
printf '# Enable via systemctl enable stroom-services.service\n\n' >> ${F}
printf '[Unit]\n' >> ${F}
printf '# Who we are\n' >> ${F}
printf 'Description=Stroom Service\n' >> ${F}
printf '# We want the network and httpd up before us\n' >> ${F}
printf 'Requires=network-online.target httpd.service\n' >> ${F}
printf 'After= httpd.service network-online.target\n\n' >> ${F}
printf '[Service]\n' >> ${F}
printf '# Source our environment file so the Stroom service start/stop scripts work\n' >> ${F}
printf 'EnvironmentFile=/home/stroomuser/env_service.sh\n' >> ${F}
printf 'Type=oneshot\n' >> ${F}
printf 'ExecStart=/bin/su --login stroomuser /home/stroomuser/bin/StartServices.sh\n' >> ${F}
printf 'ExecStop=/bin/su --login stroomuser /home/stroomuser/bin/StopServices.sh\n' >> ${F}
printf 'RemainAfterExit=yes\n\n' >> ${F}
printf '[Install]\n' >> ${F}
printf 'WantedBy=multi-user.target\n' >> ${F}
chmod 640 ${F}
Single Node Scenario with local database
Should you only have a deployment where the database is on a processing node, use the following service script. The only
difference is the Stroom dependency on the database. The database dependency below is for the MariaDB database. If you had
installed the MySQL Community database, then replace mariadb.service with mysqld.service.
(Noting this is done as root)
sudo bash
F=/etc/systemd/system/stroom-services.service
printf '# Install in /etc/systemd/system\n' > ${F}
printf '# Enable via systemctl enable stroom-services.service\n\n' >> ${F}
printf '[Unit]\n' >> ${F}
printf '# Who we are\n' >> ${F}
printf 'Description=Stroom Service\n' >> ${F}
printf '# We want the network, httpd and Database up before us\n' >> ${F}
printf 'Requires=network-online.target httpd.service mariadb.service\n' >> ${F}
printf 'After=mariadb.service httpd.service network-online.target\n\n' >> ${F}
printf '[Service]\n' >> ${F}
printf '# Source our environment file so the Stroom service start/stop scripts work\n' >> ${F}
printf 'EnvironmentFile=/home/stroomuser/env_service.sh\n' >> ${F}
printf 'Type=oneshot\n' >> ${F}
printf 'ExecStart=/bin/su --login stroomuser /home/stroomuser/bin/StartServices.sh\n' >> ${F}
printf 'ExecStop=/bin/su --login stroomuser /home/stroomuser/bin/StopServices.sh\n' >> ${F}
printf 'RemainAfterExit=yes\n\n' >> ${F}
printf '[Install]\n' >> ${F}
printf 'WantedBy=multi-user.target\n' >> ${F}
chmod 640 ${F}
Enable the service
Now we enable the Stroom service, but we DO NOT start it as we will manually start the Stroom services as part of
the installation process.
systemctl enable stroom-services.service
4.9 - SSL Certificate Generation
A HOWTO to assist users in setting up various SSL Certificates to support a Web interface to Stroom.
Assumptions
The following assumptions are used in this document.
- the user has reasonable RHEL/Centos System administration skills
- installations are on Centos 7.3 minimal systems (fully patched)
- either a Stroom Proxy or Stroom Application has already been deployed
- processing node names are ‘stroomp00.strmdev00.org’ and ‘stroomp01.strmdev00.org’
- the first node, ‘stroomp00.strmdev00.org’ also has a CNAME ‘stroomp.strmdev00.org’
- in the scenario of a Stroom Forwarding Proxy, the node name is ‘stroomfp0.strmdev00.org’
- in the scenario of a Stroom Standalone Proxy, the node name is ‘stroomsap0.strmdev00.org’
- stroom runs as user ‘stroomuser’
- the use of self signed certificates is appropriate for test systems, but users should consider appropriate CA infrastructure in production environments
- in this document, when a screen capture is documented, data entry is identified by the data surrounded by ‘<’ ‘>’ . This excludes enter/return presses.
Create certificates
The first step is to establish a self signed certificate for our Stroom service. If you have a certificate server, then certainly gain an
appropriately signed certificate. For this HOWTO, we will stay with a self signed solution and hence no certificate authorities are
involved. If you are deploying a cluster, then you will only have one certificate for all nodes. We achieve this by setting up an
alias for the first node in the cluster and then use that alias for addressing the cluster. That is, we have set up a
CNAME, stroomp.strmdev00.org for stroomp00.strmdev00.org. This means within the web service we deploy, the ServerName will be stroomp.strmdev00.org
on each node. Since it’s one certificate we only need to set it up on one node then deploy the certificate key files to other nodes.
As the certificates will be stored in the stroomuser's home directory, we become the stroom user
sudo -i -u stroomuser
Use host variable
To make things simpler in the following bash extracts, we establish the bash variable H to be used in filename generation. The variable name
is set to the name of the host (or cluster alias) your are deploying the certificates on. In our multi node HOWTO example we are using, we
would use the host CNAME stroomp. Thus we execute
export H=stroomp
Note in our the Stroom Forwarding Proxy HOWTO we would use the name stroomfp0. In the case of our Standalone Proxy we would use stroomsap0.
We set up a directory to house our certificates via
cd ~stroomuser
rm -rf stroom-jks
mkdir -p stroom-jks stroom-jks/public stroom-jks/private
cd stroom-jks
Create a server key for Stroom service (enter a password when prompted for both initial and verification prompts)
openssl genrsa -des3 -out private/$H.key 2048
as per
Generating RSA private key, 2048 bit long modulus
.................................................................+++
...............................................+++
e is 65537 (0x10001)
Enter pass phrase for private/stroomp.key: <__ENTER_SERVER_KEY_PASSWORD__>
Verifying - Enter pass phrase for private/stroomp.key: <__ENTER_SERVER_KEY_PASSWORD__>
Create a signing request. The two important prompts are the password and Common Name. All the rest can use the defaults offered.
The requested password is for the server key and you should use the host (or cluster alias) your are deploying the certificates on for
the Common Name. In the output below we will assume a multi node cluster certificate is being generated, so will use stroomp.strmdev00.org.
openssl req -sha256 -new -key private/$H.key -out $H.csr
as per
Enter pass phrase for private/stroomp.key: <__ENTER_SERVER_KEY_PASSWORD__>
You are about to be asked to enter information that will be incorporated
into your certificate request.
What you are about to enter is what is called a Distinguished Name or a DN.
There are quite a few fields but you can leave some blank
For some fields there will be a default value,
If you enter '.', the field will be left blank.
-----
Country Name (2 letter code) [XX]:
State or Province Name (full name) []:
Locality Name (eg, city) [Default City]:
Organization Name (eg, company) [Default Company Ltd]:
Organizational Unit Name (eg, section) []:
Common Name (eg, your name or your server's hostname) []:<__ stroomp.strmdev00.org __>
Email Address []:

Please enter the following 'extra' attributes
to be sent with your certificate request
A challenge password []:
An optional company name []:
We now self sign the certificate (again enter the server key password)
openssl x509 -req -sha256 -days 720 -in $H.csr -signkey private/$H.key -out public/$H.crt
as per
Signature ok
subject=/C=XX/L=Default City/O=Default Company Ltd/CN=stroomp.strmdev00.org
Getting Private key
Enter pass phrase for private/stroomp.key: <__ENTER_SERVER_KEY_PASSWORD__>
and noting the subject will change depending on the host name used when generating the signing request.
Create insecure version of private key for Apache autoboot (you will again need to enter the server key password)
openssl rsa -in private/$H.key -out private/$H.key.insecure
as per
Enter pass phrase for private/stroomp.key: <__ENTER_SERVER_KEY_PASSWORD__>
writing RSA key
and then move the insecure keys as appropriate
mv private/$H.key private/$H.key.secure
chmod 600 private/$H.key.secure
mv private/$H.key.insecure private/$H.key
We have now completed the creation of our certificates and keys.
Replication of Keys Directory to other nodes
If you are deploying a multi node Stroom cluster, then you would replicate the directory ~stroomuser/stroom-jks to each node in the cluster. That is,
tar it up, copy the tar file to the other node(s) then untar it. We can make use of the other node’s mounted file system for this process.
That is one could execute the commands on the first node, where we created the certificates
cd ~stroomuser
tar cf stroom-jks.tar stroom-jks
mv stroom-jks.tar /stroomdata/stroom-data-p01
then on the another node, say stroomp01.strmdev00.org, as the stroomuser we extract the data.
sudo -i -u stroomuser
cd ~stroomuser
tar xf /stroomdata/stroom-data-p01/stroom-jks.tar && rm -f /stroomdata/stroom-data-p01/stroom-jks.tar
Protection, Ownership and SELinux Context
Now ensure protection, ownership and SELinux context for these key files on ALL nodes via
chmod 700 ~stroomuser/stroom-jks/private ~stroomuser/stroom-jks
chown -R stroomuser:stroomuser ~stroomuser/stroom-jks
chcon -R --reference /etc/pki ~stroomuser/stroom-jks
Stroom Proxy to Proxy Key and Trust Stores
In order for a Stroom Forwarding Proxy to communicate to a central Stroom proxy over https, the JVM running the forwarding proxy needs
relevant keystores set up.
One would set up a Stroom’s forwarding proxy SSL certificate as per above, with the change that the
hostname would be different. That is, in the initial setup, we would set the hostname variable H to be the hostname of the forwarding
proxy. Lets say it is stroomfp0 thus we would set
export H=stroomfp0
and then proceed as above.
Note that you also need the public key of the central Stroom server you will be connecting to. For the following, we will assume
the central Stroom proxy is the stroomp.strmdev00.org server and it’s public key is stored in the file stroomp.crt. We will store
this file on the forwarding proxy in ~stroomuser/stroom-jks/public/stroomp.crt.
So once you have created the forwarding proxy server’s SSL keys and have deployed the central proxy’s public key, we next
need to convert the proxy server’s SSL keys into DER format. This is done by executing the following.
cd ~stroomuser/stroom-jks
export H=stroomfp0
export S=stroomp
rm -f ${H}_k.jks ${S}_t.jks
H_k=${H}
S_k=${S}
# Convert public key
openssl x509 -in public/$H.crt -inform PERM -out public/$H.crt.der -outform DER
When you convert the local server’s private key, you will be prompted for the server key password.
# Convert the local server's Private key
openssl pkcs8 -topk8 -nocrypt -in private/$H.key.secure -inform PEM -out private/$H.key.der -outform DER
as per
Enter pass phrase for private/stroomfp0.key.secure: <__ENTER_SERVER_KEY_PASSWORD__>
We now import these keys into our Key Store. As part of the Stroom Proxy release, an Import Keystore application has been provisioned. We identify where it’s found with the command
find ~stroomuser/*proxy -name 'stroom*util*.jar' -print | head -1
which should return /home/stroomuser/stroom-proxy/lib/stroom-proxy-util-v5.1-beta.10.jar or similar depending on the release version.
To make execution simpler, we set this as a shell variable as per
Stroom_UTIL_JAR=`find ~/*proxy -name 'stroom*util*.jar' -print | head -1`
We now create the keystore and import the proxy’s server key
java -cp ${Stroom_UTIL_JAR} stroom.util.cert.ImportKey keystore=${H}_k.jks keypass=$H alias=$H keyfile=private/$H.key.der certfile=public/$H.crt.der
as per
One certificate, no chain
We now import the destination server’s public key
keytool -import -noprompt -alias ${S} -file public/${S}.crt -keystore ${S}_k.jks -storepass ${S}
as per
Certificate was added to keystore
We now add the key and trust store location and password arguments to our Stroom proxy environment files.
PWD=`pwd`
echo "export JAVA_OPTS=\"-Djavax.net.ssl.trustStore=${PWD}/${S}_k.jks -Djavax.net.ssl.trustStorePassword=${S} -Djavax.net.ssl.keyStore=${PWD}/${H}_k.jks -Djavax.net.ssl.keyStorePassword=${H}\"" >> ~/env.sh
echo "JAVA_OPTS=\"-Djavax.net.ssl.trustStore=${PWD}/${S}_k.jks -Djavax.net.ssl.trustStorePassword=${S} -Djavax.net.ssl.keyStore=${PWD}/${H}_k.jks -Djavax.net.ssl.keyStorePassword=${H}\"" >> ~/env_service.sh
At this point you should restart the proxy service. Using the commands
cd ~stroomuser
source ./env.sh
stroom-proxy/bin/stop.sh
stroom-proxy/bin/start.sh
then check the logs to ensure it started correctly.
4.10 - Testing Stroom Installation
This HOWTO will demonstrate various ways to test that your Stroom installation has been successful.
Assumptions
Stroom Single or Multi Node Cluster Testing
Data Post Tests
Simple Post tests
These tests are to ensure the Stroom Store proxy and it’s connection to the database is working along with the Apache mod_jk loadbalancer.
We will send a file to the load balanced stroomp.strmdev00.org node (really stroomp00.strmdev00.org) and each time we send the file,
it’s receipt should be managed by alternate proxy nodes. As a number of elements can effect load balancing, it is not always guaranteed
to alternate every time but for the most part it will.
Perform the following
- Log onto the Stroom database node (stroomdb0.strmdev00.org) as any user.
- Log onto both Stroom nodes and become the
stroomuser and monitor each node’s Stroom proxy service using the Tp bash macro. That is, on each node, run
sudo -i -u stroomuser
Tp
You will note events of the form from
stroomp00.strmdev00.org:
...
2017-01-14T06:22:26.672Z INFO  [ProxyProperties refresh thread 0] datafeed.ProxyHandlerFactory$1 (ProxyHandlerFactory.java:96) - refreshThread() - Started
2017-01-14T06:30:00.993Z INFO  [Repository Reader Thread 1] handler.ProxyRepositoryReader (ProxyRepositoryReader.java:143) - run() - Cron Match at 2017-01-14T06:30:00.993Z
2017-01-14T06:40:00.245Z INFO  [Repository Reader Thread 1] handler.ProxyRepositoryReader (ProxyRepositoryReader.java:143) - run() - Cron Match at 2017-01-14T06:40:00.245Z
and from stroomp01.strmdev00.org:
...
2017-01-14T06:22:26.828Z INFO  [ProxyProperties refresh thread 0] datafeed.ProxyHandlerFactory$1 (ProxyHandlerFactory.java:96) - refreshThread() - Started
2017-01-14T06:30:00.066Z INFO  [Repository Reader Thread 1] handler.ProxyRepositoryReader (ProxyRepositoryReader.java:143) - run() - Cron Match at 2017-01-14T06:30:00.066Z
2017-01-14T06:40:00.318Z INFO  [Repository Reader Thread 1] handler.ProxyRepositoryReader (ProxyRepositoryReader.java:143) - run() - Cron Match at 2017-01-14T06:40:00.318Z
- On the Stroom database node, execute the command
curl -k --data-binary @/etc/group "https://stroomp.strmdev00.org/stroom/datafeed" -H "Feed:TEST-FEED-V1_0" -H "System:EXAMPLE_SYSTEM" -H "Environment:EXAMPLE_ENVIRONMENT"
If you are monitoring the proxy log of stroomp00.strmdev00.org you would see two new logs indicating the successful arrival of the file
2017-01-14T06:46:06.411Z INFO  [ajp-apr-9009-exec-1] handler.LogRequestHandler (LogRequestHandler.java:37) - log() - guid=54dc0da2-f35c-4dc2-8a98-448415ffc76b,feed=TEST-FEED-V1_0,system=EXAMPLE_SYSTEM,environment=EXAMPLE_ENVIRONMENT,remotehost=192.168.2.144,remoteaddress=192.168.2.144
2017-01-14T06:46:06.449Z INFO  [ajp-apr-9009-exec-1] datafeed.DataFeedRequestHandler$1 (DataFeedRequestHandler.java:104) - "doPost() - Took 571 ms to process (concurrentRequestCount=1) 200","Environment=EXAMPLE_ENVIRONMENT","Feed=TEST-FEED-V1_0","GUID=54dc0da2-f35c-4dc2-8a98-448415ffc76b","ReceivedTime=2017-01-14T06:46:05.883Z","RemoteAddress=192.168.2.144","RemoteHost=192.168.2.144","System=EXAMPLE_SYSTEM","accept=*/*","content-length=527","content-type=application/x-www-form-urlencoded","host=stroomp.strmdev00.org","user-agent=curl/7.29.0"
- On the Stroom database node, again execute the command
curl -k --data-binary @/etc/group "https://stroomp.strmdev00.org/stroom/datafeed" -H "Feed:TEST-FEED-V1_0" -H "System:EXAMPLE_SYSTEM" -H "Environment:EXAMPLE_ENVIRONMENT"
If you are monitoring the proxy log of stroomp01.strmdev00.org you should see a new log. As foreshadowed, we didn’t as the time delay resulted
in the first node getting the file. That is stroomp00.strmdev00.org log file gained the two entries
2017-01-14T06:47:26.642Z INFO  [ajp-apr-9009-exec-2] handler.LogRequestHandler (LogRequestHandler.java:37) - log() - guid=941d2904-734f-4764-9ccf-4124b94a56f6,feed=TEST-FEED-V1_0,system=EXAMPLE_SYSTEM,environment=EXAMPLE_ENVIRONMENT,remotehost=192.168.2.144,remoteaddress=192.168.2.144
2017-01-14T06:47:26.645Z INFO  [ajp-apr-9009-exec-2] datafeed.DataFeedRequestHandler$1 (DataFeedRequestHandler.java:104) - "doPost() - Took 174 ms to process (concurrentRequestCount=1) 200","Environment=EXAMPLE_ENVIRONMENT","Feed=TEST-FEED-V1_0","GUID=941d2904-734f-4764-9ccf-4124b94a56f6","ReceivedTime=2017-01-14T06:47:26.470Z","RemoteAddress=192.168.2.144","RemoteHost=192.168.2.144","System=EXAMPLE_SYSTEM","accept=*/*","content-length=527","content-type=application/x-www-form-urlencoded","host=stroomp.strmdev00.org","user-agent=curl/7.29.0"
- Again on the database node, execute the command and this time we see that node
stroomp01.strmdev00.org received the file as per
2017-01-14T06:47:30.782Z INFO  [ajp-apr-9009-exec-1] handler.LogRequestHandler (LogRequestHandler.java:37) - log() - guid=2cef6e23-b0e6-4d75-8374-cca7caf66e15,feed=TEST-FEED-V1_0,system=EXAMPLE_SYSTEM,environment=EXAMPLE_ENVIRONMENT,remotehost=192.168.2.144,remoteaddress=192.168.2.144
2017-01-14T06:47:30.816Z INFO  [ajp-apr-9009-exec-1] datafeed.DataFeedRequestHandler$1 (DataFeedRequestHandler.java:104) - "doPost() - Took 593 ms to process (concurrentRequestCount=1) 200","Environment=EXAMPLE_ENVIRONMENT","Feed=TEST-FEED-V1_0","GUID=2cef6e23-b0e6-4d75-8374-cca7caf66e15","ReceivedTime=2017-01-14T06:47:30.238Z","RemoteAddress=192.168.2.144","RemoteHost=192.168.2.144","System=EXAMPLE_SYSTEM","accept=*/*","content-length=527","content-type=application/x-www-form-urlencoded","host=stroomp.strmdev00.org","user-agent=curl/7.29.0"
- Running the curl post command in quick succession shows the loadbalancer working … four executions result in seeing our pair of logs appearing on alternate proxies.
stroomp00:
2017-01-14T06:52:09.815Z INFO  [ajp-apr-9009-exec-3] handler.LogRequestHandler (LogRequestHandler.java:37) - log() - guid=bf0bc38c-3533-4d5c-9ddf-5d30c0302787,feed=TEST-FEED-V1_0,system=EXAMPLE_SYSTEM,environment=EXAMPLE_ENVIRONMENT,remotehost=192.168.2.144,remoteaddress=192.168.2.144
2017-01-14T06:52:09.817Z INFO  [ajp-apr-9009-exec-3] datafeed.DataFeedRequestHandler$1 (DataFeedRequestHandler.java:104) - "doPost() - Took 262 ms to process (concurrentRequestCount=1) 200","Environment=EXAMPLE_ENVIRONMENT","Feed=TEST-FEED-V1_0","GUID=bf0bc38c-3533-4d5c-9ddf-5d30c0302787","ReceivedTime=2017-01-14T06:52:09.555Z","RemoteAddress=192.168.2.144","RemoteHost=192.168.2.144","System=EXAMPLE_SYSTEM","accept=*/*","content-length=527","content-type=application/x-www-form-urlencoded","host=stroomp.strmdev00.org","user-agent=curl/7.29.0"
stroomp01:
2017-01-14T06:52:11.139Z INFO  [ajp-apr-9009-exec-2] handler.LogRequestHandler (LogRequestHandler.java:37) - log() - guid=1088fdd8-6869-489f-8baf-948891363734,feed=TEST-FEED-V1_0,system=EXAMPLE_SYSTEM,environment=EXAMPLE_ENVIRONMENT,remotehost=192.168.2.144,remoteaddress=192.168.2.144
2017-01-14T06:52:11.150Z INFO  [ajp-apr-9009-exec-2] datafeed.DataFeedRequestHandler$1 (DataFeedRequestHandler.java:104) - "doPost() - Took 289 ms to process (concurrentRequestCount=1) 200","Environment=EXAMPLE_ENVIRONMENT","Feed=TEST-FEED-V1_0","GUID=1088fdd8-6869-489f-8baf-948891363734","ReceivedTime=2017-01-14T06:52:10.861Z","RemoteAddress=192.168.2.144","RemoteHost=192.168.2.144","System=EXAMPLE_SYSTEM","accept=*/*","content-length=527","content-type=application/x-www-form-urlencoded","host=stroomp.strmdev00.org","user-agent=curl/7.29.0"
stroomp00:
2017-01-14T06:52:12.284Z INFO  [ajp-apr-9009-exec-4] handler.LogRequestHandler (LogRequestHandler.java:37) - log() - guid=def94a4a-cf78-4c4d-9261-343663f7f79a,feed=TEST-FEED-V1_0,system=EXAMPLE_SYSTEM,environment=EXAMPLE_ENVIRONMENT,remotehost=192.168.2.144,remoteaddress=192.168.2.144
2017-01-14T06:52:12.289Z INFO  [ajp-apr-9009-exec-4] datafeed.DataFeedRequestHandler$1 (DataFeedRequestHandler.java:104) - "doPost() - Took 5.0 ms to process (concurrentRequestCount=1) 200","Environment=EXAMPLE_ENVIRONMENT","Feed=TEST-FEED-V1_0","GUID=def94a4a-cf78-4c4d-9261-343663f7f79a","ReceivedTime=2017-01-14T06:52:12.284Z","RemoteAddress=192.168.2.144","RemoteHost=192.168.2.144","System=EXAMPLE_SYSTEM","accept=*/*","content-length=527","content-type=application/x-www-form-urlencoded","host=stroomp.strmdev00.org","user-agent=curl/7.29.0"
stroomp01:
2017-01-14T06:52:13.374Z INFO  [ajp-apr-9009-exec-3] handler.LogRequestHandler (LogRequestHandler.java:37) - log() - guid=55dda4c9-2c76-43c8-9b48-dcdb3a1f459b,feed=TEST-FEED-V1_0,system=EXAMPLE_SYSTEM,environment=EXAMPLE_ENVIRONMENT,remotehost=192.168.2.144,remoteaddress=192.168.2.144
2017-01-14T06:52:13.378Z INFO  [ajp-apr-9009-exec-3] datafeed.DataFeedRequestHandler$1 (DataFeedRequestHandler.java:104) - "doPost() - Took 3.0 ms to process (concurrentRequestCount=1) 200","Environment=EXAMPLE_ENVIRONMENT","Feed=TEST-FEED-V1_0","GUID=55dda4c9-2c76-43c8-9b48-dcdb3a1f459b","ReceivedTime=2017-01-14T06:52:13.374Z","RemoteAddress=192.168.2.144","RemoteHost=192.168.2.144","System=EXAMPLE_SYSTEM","accept=*/*","content-length=527","content-type=application/x-www-form-urlencoded","host=stroomp.strmdev00.org","user-agent=curl/7.29.0"
At this point we will see what the proxies have received.
- On each node run the command
ls -l /stroomdata/stroom-working*/proxy
On stroomp00 we see
[stroomuser@stroomp00 ~]$ ls -l /stroomdata/stroom-working*/proxy
total 16
-rw-rw-r--. 1 stroomuser stroomuser 785 Jan 14 17:46 001.zip
-rw-rw-r--. 1 stroomuser stroomuser 783 Jan 14 17:47 002.zip
-rw-rw-r--. 1 stroomuser stroomuser 784 Jan 14 17:52 003.zip
-rw-rw-r--. 1 stroomuser stroomuser 783 Jan 14 17:52 004.zip
[stroomuser@stroomp00 ~]$
and on stroomp01 we see
[stroomuser@stroomp01 ~]$ ls -l /stroomdata/stroom-working*/proxy
total 12
-rw-rw-r--. 1 stroomuser stroomuser 785 Jan 14 17:47 001.zip
-rw-rw-r--. 1 stroomuser stroomuser 783 Jan 14 17:52 002.zip
-rw-rw-r--. 1 stroomuser stroomuser 784 Jan 14 17:52 003.zip
[stroomuser@stroomp01 ~]$
which corresponds to the seven posts of data and the associated events in the proxy logs. To see the contents of one of these files we execute on either node, the command
unzip -c /stroomdata/stroom-working*/proxy/001.zip
to see
Archive:  /stroomdata/stroom-working-p00/proxy/001.zip
  inflating: 001.dat
root:x:0:
bin:x:1:
daemon:x:2:
sys:x:3:
adm:x:4:
tty:x:5:
disk:x:6:
lp:x:7:
mem:x:8:
kmem:x:9:
wheel:x:10:burn
cdrom:x:11:
mail:x:12:postfix
man:x:15:
dialout:x:18:
floppy:x:19:
games:x:20:
tape:x:30:
video:x:39:
ftp:x:50:
lock:x:54:
audio:x:63:
nobody:x:99:
users:x:100:
utmp:x:22:
utempter:x:35:
input:x:999:
systemd-journal:x:190:
systemd-bus-proxy:x:998:
systemd-network:x:192:
dbus:x:81:
polkitd:x:997:
ssh_keys:x:996:
dip:x:40:
tss:x:59:
sshd:x:74:
postdrop:x:90:
postfix:x:89:
chrony:x:995:
burn:x:1000:burn
mysql:x:27:

  inflating: 001.meta
content-type:application/x-www-form-urlencoded
Environment:EXAMPLE_ENVIRONMENT
Feed:TEST-FEED-V1_0
GUID:54dc0da2-f35c-4dc2-8a98-448415ffc76b
host:stroomp.strmdev00.org
ReceivedTime:2017-01-14T06:46:05.883Z
RemoteAddress:192.168.2.144
RemoteHost:192.168.2.144
StreamSize:527
System:EXAMPLE_SYSTEM
user-agent:curl/7.29.0

[stroomuser@stroomp00 ~]$
Checking the /etc/group file on stroomdb0.strmdev00.org confirms the above contents. For the present, ignore
the metadata file present in the zip archive.
If you execute the same command on the other files, all that changes is the value of the ReceivedTime: attribute in the .meta file.
For those curious about the file size differences, this is a function of the compression process within the proxy.
Using stroomp01’s files and extracting them manually and renaming them results in the six files
[stroomuser@stroomp01 xx]$ ls -l
total 24
-rw-rw-r--. 1 stroomuser stroomuser 527 Jan 14 17:47 A_001.dat
-rw-rw-r--. 1 stroomuser stroomuser 321 Jan 14 17:47 A_001.meta
-rw-rw-r--. 1 stroomuser stroomuser 527 Jan 14 17:52 B_001.dat
-rw-rw-r--. 1 stroomuser stroomuser 321 Jan 14 17:52 B_001.meta
-rw-rw-r--. 1 stroomuser stroomuser 527 Jan 14 17:52 C_001.dat
-rw-rw-r--. 1 stroomuser stroomuser 321 Jan 14 17:52 C_001.meta
[stroomuser@stroomp01 xx]$ cmp A_001.dat B_001.dat
[stroomuser@stroomp01 xx]$ cmp B_001.dat C_001.dat
[stroomuser@stroomp01 xx]$
We have effectively tested the receipt of our data and the load balancing of the Apache mod_jk installation.
Simple Direct Post tests
In this test we will use the direct feed interface of the Stroom application, rather than sending data via the proxy.
One would normally use this interface for time sensitive data which shouldn’t aggregate in a proxy waiting for
the Stroom application to collect it. In this situation we use the command
curl -k --data-binary @/etc/group "https://stroomp.strmdev00.org/stroom/datafeed/direct" -H "Feed:TEST-FEED-V1_0" -H "System:EXAMPLE_SYSTEM" -H "Environment:EXAMPLE_ENVIRONMENT"
To prepare for this test, we monitor the Stroom application log using the T bash alias on each node. So on each node run the command
sudo -i -u stroomuser
T
On each node you should see LifecyleTask events, for example,
2017-01-14T07:42:08.281Z INFO  [Stroom P2 #7 - LifecycleTask] spring.StroomBeanMethodExecutable (StroomBeanMethodExecutable.java:47) - Executing nodeStatusExecutor.exec
2017-01-14T07:42:18.284Z INFO  [Stroom P2 #2 - LifecycleTask] spring.StroomBeanMethodExecutable (StroomBeanMethodExecutable.java:47) - Executing SQLStatisticEventStore.evict
2017-01-14T07:42:18.284Z INFO  [Stroom P2 #10 - LifecycleTask] spring.StroomBeanMethodExecutable (StroomBeanMethodExecutable.java:47) - Executing activeQueriesManager.evictExpiredElements
2017-01-14T07:42:18.285Z INFO  [Stroom P2 #7 - LifecycleTask] spring.StroomBeanMethodExecutable (StroomBeanMethodExecutable.java:47) - Executing distributedTaskFetcher.execute
To perform the test, on the database node, run the posting command a number of times in rapid succession. This will result
in server.DataFeedServiceImpl events in both log files. The Stroom application log is quite busy, you may have to look for these logs.
In the following we needed to execute the posting command three times before seeing the data arrive on both nodes. Looking at the arrival
times, the file turned up on the second node twice before appearing on the first node.
strooomp00:
2017-01-14T07:43:09.394Z INFO [ajp-apr-8009-exec-6] server.DataFeedServiceImpl (DataFeedServiceImpl.java:133) - handleRequest response 200 - 0 - OK
and on stroomp01:
2017-01-14T07:43:05.614Z INFO  [ajp-apr-8009-exec-1] server.DataFeedServiceImpl (DataFeedServiceImpl.java:133) - handleRequest response 200 - 0 - OK
2017-01-14T07:43:06.821Z INFO  [ajp-apr-8009-exec-2] server.DataFeedServiceImpl (DataFeedServiceImpl.java:133) - handleRequest response 200 - 0 - OK
To confirm this data arrived, we need to view the Data pane of our TEST-FEED-V1_0 tab. To do this, log onto the Stroom UI then
move the cursor to the TEST-FEED-V1_0 entry in the Explorer tab and select the item with a left click
and double click on the entry to see our TEST-FEED-V1_0 tab.
and it is noted that we are viewing the Feed’s attributes as we can see the
Setting hyper-link highlighted.
As we want to see the Data we have received for this feed, move the cursor to the
Data hyper-link and select it to see
.
These three entries correspond to the three posts we performed.
We have successfully tested direct posting to a Stroom feed and that the Apache mod_jk loadbalancer also works for this posting method.
Test Proxy Aggregation is Working
To test that the Proxy Aggregation is working,
we need to enable on each node.
By enabling the Proxy Aggregation process, both nodes immediately performed the task as indicated by each node’s Stroom application logs as per
stroomp00:
2017-01-14T07:58:58.752Z INFO  [Stroom P2 #3 - LifecycleTask] server.ProxyAggregationExecutor (ProxyAggregationExecutor.java:138) - exec() - started
2017-01-14T07:58:58.937Z INFO  [Stroom P2 #2 - GenericServerTask] server.ProxyAggregationExecutor$2 (ProxyAggregationExecutor.java:203) - processFeedFiles() - Started TEST-FEED-V1_0 (4 Files)
2017-01-14T07:58:59.045Z INFO  [Stroom P2 #2 - GenericServerTask] server.ProxyAggregationExecutor$2 (ProxyAggregationExecutor.java:265) - processFeedFiles() - Completed TEST-FEED-V1_0 in 108 ms
2017-01-14T07:58:59.101Z INFO  [Stroom P2 #3 - LifecycleTask] server.ProxyAggregationExecutor (ProxyAggregationExecutor.java:152) - exec() - completedin 349 ms
and stroomp01:
2017-01-14T07:59:16.687Z INFO  [Stroom P2 #10 - LifecycleTask] server.ProxyAggregationExecutor (ProxyAggregationExecutor.java:138) - exec() - started
2017-01-14T07:59:16.799Z INFO  [Stroom P2 #5 - GenericServerTask] server.ProxyAggregationExecutor$2 (ProxyAggregationExecutor.java:203) - processFeedFiles() - Started TEST-FEED-V1_0 (3 Files)
2017-01-14T07:59:16.909Z INFO  [Stroom P2 #5 - GenericServerTask] server.ProxyAggregationExecutor$2 (ProxyAggregationExecutor.java:265) - processFeedFiles() - Completed TEST-FEED-V1_0 in 110 ms
2017-01-14T07:59:16.997Z INFO  [Stroom P2 #10 - LifecycleTask] server.ProxyAggregationExecutor (ProxyAggregationExecutor.java:152) - exec() - completed in 310 ms
And on refreshing the top pane of the TEST-FEED-V1_0 tab we see that two more batches of data have arrived.
.
This demonstrates that Proxy Aggregation is working.
Stroom Forwarding Proxy Testing
Data Post Tests
Simple Post tests
This test is to ensure the Stroom Forwarding proxy and it’s connection to the central Stroom Processing system is working.
We will send a file to our Forwarding proxy (stroomfp0.strmdev00.org) and monitor this nodes’ proxy log files as well as all the
destination nodes proxy log files. The reason for monitoring all the destination system’s proxy log files is that the destination system is
probably load balancing and hence the forwarded file may turn up on any of the destination nodes.
Perform the following
- Log onto any host where you will perform the
curl post
- Monitor all proxy log files
- Log onto the Forwarding Proxy node and become the
stroomuser and monitor the Stroom proxy service using the Tp bash macro.
- Log onto the destination Stroom nodes and become the
stroomuser and monitor each node’s Stroom proxy service using the Tp bash macro. That is, on each node, run
sudo -i -u stroomuser
Tp
- On the ‘posting’ node, run the command
curl -k --data-binary @/etc/group "https://stroomfp0.strmdev00.org/stroom/datafeed" -H "Feed:TEST-FEED-V1_0" -H "System:EXAMPLE_SYSTEM" -H "Environment:EXAMPLE_ENVIRONMENT"
In the Stroom Forwarding proxy log, ~/stroom-proxy/instance/logs/stroom.log, you will see the arrival of the
file as per the datafeed.DataFeedRequestHandler$1 event running under, in this case, the ajp-apr-9009-exec-1 thread.
...
2017-01-01T23:17:00.240Z INFO  [Repository Reader Thread 1] handler.ProxyRepositoryReader (ProxyRepositoryReader.java:143) - run() - Cron Match at 2017-01-01T23:17:00.240Z
2017-01-01T23:18:00.275Z INFO  [Repository Reader Thread 1] handler.ProxyRepositoryReader (ProxyRepositoryReader.java:143) - run() - Cron Match at 2017-01-01T23:18:00.275Z
2017-01-01T23:18:12.367Z INFO  [ajp-apr-9009-exec-1] datafeed.DataFeedRequestHandler$1 (DataFeedRequestHandler.java:104) - "doPost() - Took 782 ms to process (concurrentRequestCount=1) 200","Environment=EXAMPLE_ENVIRONMENT","Expect=100-continue","Feed=TEST-FEED-V1_0","GUID=9601198e-98db-4cae-8b71-9404722ef1f9","ReceivedTime=2017-01-01T23:18:11.588Z","RemoteAddress=192.168.2.220","RemoteHost=192.168.2.220","System=EXAMPLE_SYSTEM","accept=*/*","content-length=1051","content-type=application/x-www-form-urlencoded","host=stroomfp0.strmdev00.org","user-agent=curl/7.19.7 (x86_64-redhat-linux-gnu) libcurl/7.19.7 NSS/3.21 Basic ECC zlib/1.2.3 libidn/1.18 libssh2/1.4.2"
And then at the next
periodic interval (60 second intervals) this file will be forwarded to the main stroom proxy
server stroomp.strmdev00.org as shown by the handler.ForwardRequestHandler events running under the pool-10-thread-2 thread.
2017-01-01T23:19:00.304Z INFO  [Repository Reader Thread 1] handler.ProxyRepositoryReader (ProxyRepositoryReader.java:143) - run() - Cron Match at 2017-01-01T23:19:00.304Z
2017-01-01T23:19:00.586Z INFO  [pool-10-thread-2] handler.ForwardRequestHandler (ForwardRequestHandler.java:109) - handleHeader() - https://stroomp00.strmdev00.org/stroom/datafeed Sending request {ReceivedPath=stroomfp0.strmdev00.org, Feed=TEST-FEED-V1_0, Compression=ZIP}
2017-01-01T23:19:00.990Z INFO  [pool-10-thread-2] handler.ForwardRequestHandler (ForwardRequestHandler.java:89) - handleFooter() - b5722ead-714b-411b-a09f-901fb8b20389 took 403 ms to forward 1.4 kB response 200 - {ReceivedPath=stroomfp0.strmdev00.org, Feed=TEST-FEED-V1_0, GUID=b5722ead-714b-411b-a09f-901fb8b20389, Compression=ZIP}
2017-01-01T23:20:00.064Z INFO  [Repository Reader Thread 1] handler.ProxyRepositoryReader (ProxyRepositoryReader.java:143) - run() - Cron Match at 2017-01-01T23:20:00.064Z
...
On one of the central processing nodes, when the file is send by the Forwarding Proxy, you will see the file’s arrival as per
the datafeed.DataFeedRequestHandler$1 event in the ajp-apr-9009-exec-3 thread.
...
2017-01-01T23:00:00.236Z INFO  [Repository Reader Thread 1] handler.ProxyRepositoryReader (ProxyRepositoryReader.java:143) - run() - Cron Match at 2017-01-01T23:00:00.236Z
2017-01-01T23:10:00.473Z INFO  [Repository Reader Thread 1] handler.ProxyRepositoryReader (ProxyRepositoryReader.java:143) - run() - Cron Match at 2017-01-01T23:10:00.473Z
2017-01-01T23:19:00.787Z INFO  [ajp-apr-9009-exec-3] handler.LogRequestHandler (LogRequestHandler.java:37) - log() - guid=b5722ead-714b-411b-a09f-901fb8b20389,feed=TEST-FEED-V1_0,system=null,environment=null,remotehost=null,remoteaddress=null
2017-01-01T23:19:00.981Z INFO  [ajp-apr-9009-exec-3] datafeed.DataFeedRequestHandler$1 (DataFeedRequestHandler.java:104) - "doPost() - Took 196 ms to process (concurrentRequestCount=1) 200","Cache-Control=no-cache","Compression=ZIP","Feed=TEST-FEED-V1_0","GUID=b5722ead-714b-411b-a09f-901fb8b20389","ReceivedPath=stroomfp0.strmdev00.org","Transfer-Encoding=chunked","accept=text/html, image/gif, image/jpeg, *; q=.2, */*; q=.2","connection=keep-alive","content-type=application/audit","host=stroomp00.strmdev00.org","pragma=no-cache","user-agent=Java/1.8.0_111"
2017-01-01T23:20:00.771Z INFO  [Repository Reader Thread 1] handler.ProxyRepositoryReader (ProxyRepositoryReader.java:143) - run() - Cron Match at 2017-01-01T23:20:00.771Z
...
Stroom Standalone Proxy Testing
Data Post Tests
Simple Post tests
This test is to ensure the Stroom Store NODB or Standalone proxy is working.
We will send a file to our Standalone proxy (stroomsap0.strmdev00.org) and monitor this nodes’ proxy log files as well the directory the
received files are meant to be stored in.
Perform the following
- Log onto any host where you will perform the
curl post
- Log onto the Standalone Proxy node and become the
stroomuser and monitor the Stroom proxy service using the Tp bash macro. That is run
sudo -i -u stroomuser
Tp
- On the ‘posting’ node, run the command
curl -k --data-binary @/etc/group "https://stroomsap0.strmdev00.org/stroom/datafeed" -H "Feed:TEST-FEED-V1_0" -H "System:EXAMPLE_SYSTEM" -H "Environment:EXAMPLE_ENVIRONMENT"
In the stroom proxy log, ~/stroom-proxy/instance/logs/stroom.log, you will see the arrival of the file via both the handler.LogRequestHandler and datafeed.DataFeedRequestHandler$1 events running under, in this case, the ajp-apr-9009-exec-1 thread.
...
2017-01-02T02:10:00.325Z INFO  [Repository Reader Thread 1] handler.ProxyRepositoryReader (ProxyRepositoryReader.java:143) - run() - Cron Match at 2017-01-02T02:10:00.325Z
2017-01-02T02:11:34.501Z INFO  [ajp-apr-9009-exec-1] handler.LogRequestHandler (LogRequestHandler.java:37) - log() - guid=ebd11215-7d4c-4be6-a524-358015e2ac38,feed=TEST-FEED-V1_0,system=EXAMPLE_SYSTEM,environment=EXAMPLE_ENVIRONMENT,remotehost=192.168.2.220,remoteaddress=192.168.2.220
2017-01-02T02:11:34.528Z INFO  [ajp-apr-9009-exec-1] datafeed.DataFeedRequestHandler$1 (DataFeedRequestHandler.java:104) - "doPost() - Took 33 ms to process (concurrentRequestCount=1) 200","Environment=EXAMPLE_ENVIRONMENT","Expect=100-continue","Feed=TEST-FEED-V1_0","GUID=ebd11215-7d4c-4be6-a524-358015e2ac38","ReceivedTime=2017-01-02T02:11:34.501Z","RemoteAddress=192.168.2.220","RemoteHost=192.168.2.220","System=EXAMPLE_SYSTEM","accept=*/*","content-length=1051","content-type=application/x-www-form-urlencoded","host=stroomsap0.strmdev00.org","user-agent=curl/7.19.7 (x86_64-redhat-linux-gnu) libcurl/7.19.7 NSS/3.21 Basic ECC zlib/1.2.3 libidn/1.18 libssh2/1.4.2"
...
Further, if you check the proxy’s storage directory, you will see the file 001.zip. The file names number upwards from 001.
ls -l /stroomdata/stroom-working-sap0/proxy
shows
[stroomuser@stroomsap0 ~]$ ls -l /stroomdata/stroom-working-sap0/proxy
total 4
-rw-rw-r--. 1 stroomuser stroomuser 1107 Jan  2 13:11 001.zip
[stroomuser@stroomsap0 ~]$
On viewing the contents of this file we see both a .dat and .meta file.
[stroomuser@stroomsap0 ~]$ (cd /stroomdata/stroom-working-sap0/proxy; unzip 001.zip)
Archive:  001.zip
  inflating: 001.dat
  inflating: 001.meta
[stroomuser@stroomsap0 ~]$
The .dat file holds the content of the file we posted - /etc/group.
[stroomuser@stroomsap0 ~]$ (cd /stroomdata/stroom-working-sap0/proxy; head -5 001.dat)
root:x:0:
bin:x:1:bin,daemon
daemon:x:2:bin,daemon
sys:x:3:bin,adm
adm:x:4:adm,daemon
[stroomuser@stroomsap0 ~]$
The .meta file is generated by the proxy and holds information about the posted file
[stroomuser@stroomsap0 ~]$ (cd /stroomdata/stroom-working-sap0/proxy; cat 001.meta)
content-type:application/x-www-form-urlencoded
Environment:EXAMPLE_ENVIRONMENT
Feed:TEST-FEED-V1_0
GUID:ebd11215-7d4c-4be6-a524-358015e2ac38
host:stroomsap0.strmdev00.org
ReceivedTime:2017-01-02T02:11:34.501Z
RemoteAddress:192.168.2.220
RemoteHost:192.168.2.220
StreamSize:1051
System:EXAMPLE_SYSTEM
user-agent:curl/7.19.7 (x86_64-redhat-linux-gnu) libcurl/7.19.7 NSS/3.21 Basic ECC zlib/1.2.3 libidn/1.18 libssh2/1.4.2
[stroomuser@stroomsap0 ~]$ (cd /stroomdata/stroom-working-sap0/proxy; rm 001.meta 001.dat)
[stroomuser@stroomsap0 ~]$
4.11 - Volume Maintenance
How to maintain Stroom’s data and index volumes.
Stroom stores data in volumes.
These are the logical link to the Storage hierarchy we setup on the operating system.
This HOWTO will demonstrate how one first sets up volumes and also how to add additional volumes if one expanded an existing Stroom cluster.
Assumptions
- an account with the
Administrator Application Permission is currently logged in.
- we will add volumes as per the Multi Node Stroom deployment Storage hierarchy
We need to configure the volumes for Stroom. The follow demonstrates adding the volumes for two nodes, but demonstrates the process for a single node
deployment as well the volume maintenance needed when expanding a Multi Node Cluster when adding in a new node.
To configure the volumes, move to the Tools item of the Main Menu and select it to bring up the Tools sub-menu.
then move down and select the Volumes sub-item to be presented with the Volumes configuration window as seen below.
The attributes we see for each volume are
- Node - the processing node the volume resides on (this is just the node name entered when configuration the Stroom application)
- Path - the path to the volume
- Volume Type - The type of volume
- Public - to indicate that all nodes would access this volume
- Private - to indicate that only the local node will access this volume
- Stream Status
- Active - to store data within the volume
- Inactive - to NOT store data within the volume
- Closed - had stored data within the volume, but now no more data can be stored
- Index Status
- Active - to store index data within the volume
- Inactive - to NOT store index data within the volume
- Closed - had stored index data within the volume, but now no more index data can be stored
- Usage Date - the date and time the volume was last used
- Limit - the maximum amount of data the system will store on the volume
- Used - the amount of data in use on the volume
- Free - the amount of available storage on the volume
- Use% - the usage percentage
If you are setting up Stroom for the first time and you had accepted the default for the CREATE_DEFAULT_VOLUME_ON_START configuration option (true) when
configuring the Stroom service application, you will see two default volumes have already been created. Had you set this option to false then the window would be empty.
Add Volumes
Now from our two node Stroom Cluster example, our storage hierarchy was
- Node:
stroomp00.strmdev00.org
/stroomdata/stroom-data-p00 - location to store Stroom application data files (events, etc.) for this node/stroomdata/stroom-index-p00 - location to store Stroom application index files/stroomdata/stroom-working-p00 - location to store Stroom application working files (e.g. temporary files, output, etc.) for this node/stroomdata/stroom-working-p00/proxy - location for Stroom proxy to store inbound data files- Node:
stroomp01.strmdev00.org
/stroomdata/stroom-data-p01 - location to store Stroom application data files (events, etc.) for this node/stroomdata/stroom-index-p01 - location to store Stroom application index files/stroomdata/stroom-working-p01 - location to store Stroom application working files (e.g. temporary files, output, etc.) for this node/stroomdata/stroom-working-p01/proxy - location for Stroom proxy to store inbound data files
From this we need to create four volumes. On stroomp00.strmdev00.org we create
/stroomdata/stroom-data-p00 - location to store Stroom application data files (events, etc.) for this node/stroomdata/stroom-index-p00 - location to store Stroom application index files
and on stroomp01.strmdev00.org we create
/stroomdata/stroom-data-p01 - location to store Stroom application data files (events, etc.) for this node/stroomdata/stroom-index-p01 - location to store Stroom application index files
So the first step to configure a volume is to move the cursor to the New icon
 in the top left of
the
 Volumes window and select it. This will bring up the Add Volume configuration window
As you can see, the entry box titles reflect the attributes of a volume. So we will add the first
nodes data volume
/stroomdata/stroom-data-p00 - location to store Stroom application data files (events, etc.) for this node
for node stroomp00.
If you move the the Node drop down entry box and select it you will be presented with a choice of available
nodes - in this case stroomp00 and stroomp01 as we have a two node cluster with these node names.
By selecting the node stroomp00 we see
To configure the rest of the attributes for this volume, we:
- enter the Path to our first node’s data volume
- select a Volume Type of Public as this is a data volume we want all nodes to access
- select a Stream Status of Active to indicate we want to store data on it
- select an Index Status of Inactive as we do NOT want index data stored on it
- set a Limit of 12GB for allowed storage
and on selection of the
Ok
we see the changes in the Volumes configuration window
We next add the first node’s index volume, as per
And after adding the second node’s volumes we are finally presented with our configured volumes
Delete Default Volumes
We now need to deal with our default volumes. We want to delete them.
So we move the cursor to the first volume’s line (stroomp00 /home/stroomuser/stroom-app/volumes/defaultindexVolume …) and select the line then move the cursor to the Delete icon
 in the top left of the
 Volumes window and select it. On selection you will be given a confirmation request
at which we press the
Ok
button to see the first default volume has been deleted
and after we select then delete the second default volume( stroomp00 /home/stroomuser/stroom-app/volumes/defaultStreamVolume …), we are left with
At this one can close the Volumes configuration window by pressing the
Close
button.
NOTE: At the time of writing there is an issue regarding volumes
Stroom Github Issue 84 -
Due to Issue 84 (external link), if we delete volumes in a multi node environment, the deletion is not propagated to all other nodes in a cluster.
Thus if we attempted to use the volumes we would get a database error.
The current workaround is to restart all the Stroom applications which will cause a reload of all volume information.
This MUST be done before sending any data to your multi-node Stroom cluster.
Adding new Volumes
When one expands a Multi Node Stroom cluster deployment, after the installation of the Stroom Proxy and Application software and services on the new node,
one has to configure the new volumes that are on the new node. The following demonstrates this assuming we are adding
- the new node is
stroomp02
- the storage hierarchy for this node is
/stroomdata/stroom-data-p02 - location to store Stroom application data files (events, etc.) for this node/stroomdata/stroom-index-p02 - location to store Stroom application index files/stroomdata/stroom-working-p02 - location to store Stroom application working files (e.g. tmp, output, etc.) for this node/stroomdata/stroom-working-p02/proxy - location for Stroom proxy to store inbound data files
From this we need to create two volumes on stroomp02
/stroomdata/stroom-data-p02 - location to store Stroom application data files (events, etc.) for this node/stroomdata/stroom-index-p02 - location to store Stroom application index files
To configure the volumes, move to the Tools item of the Main Menu and select it to bring up the Tools sub-menu.
then move down and select the Volumes sub-item to be presented with the Volumes configuration window as.
We then move the cursor to the New icon
 in the top left of the
 Volumes window and select it.
This will bring up the Add Volume configuration window where we select our volume’s node stroomp02.
We select this node and then configure the rest of the attributes for this data volume
then press the
title
button.
We then add another volume for the index volume for this node with attributes as per
And on pressing the
Ok
button we see our two new volumes for this node have been added.
At this one can close the Volumes configuration window by pressing the
Close
button.
5 - Event Feeds
5.1 - Writing an XSLT Translation
This HOWTO will take you through the production of an XSLT for a feed, including issues such as event filtering, common errors and testing.
Introduction
This document is intended to explain how and why to produce a translation within stroom and how the translation fits into the overall processing within stroom.
It is intended for use by the developers/admins of client systems that want to send data to stroom and need to transform their events into event-logging XML format.
It’s not intended as an XSLT tutorial so a basic XSLT knowledge must be assumed.
The document will contain potentially useful XSLT fragments to show how certain processing activities can be carried out.
As with most programming languages, there are likely to be multiple ways of producing the same end result with different degrees of complexity and efficiency.
Examples here may not be the best for all situations but do reflect experience built up from many previous translation jobs.
The document should be read in conjunction with other online stroom documentation, in particular Event Processing.
Translation Overview
The translation process for raw logs is a multi-stage process defined by the processing pipeline:
Parser
The parser takes raw data and converts it into an intermediate XML document format.
This is only required if source data is not already within an XML document.
There are various standard parsers available (although not all may be available on a default stroom build) to cover the majority of standard source formats such as CSV, TSV, CSV with header row and XML fragments.
The language used within the parser is defined within an XML schema located at XML Schemas / data-splitter / data-splitter v3.0 within the tree browser.
The data splitter schema may have been provided as part of the core schemas content pack.
It is not present in a vanilla stroom.
The language can be quite complex so if non-standard format logs are being parsed, it may be worth speaking to your stroom sysadmin team to at least get an initial parser configured for your data.
Stroom also has a built-in parser for JSON fragments.
This can be set either by using the
 combinedParser
and setting the
 type property to JSON or preferably by just using the
 jsonParser
.
The parser has several minor limitations.
The most significant is that it’s unable to deal with records that are interleaved.
This occasionally happens within multi-line syslog records where a syslog server receives the first x lines of record A followed by the first y lines of record B, then the rest of record A and finally the rest of record B (or the start of record C etc).
If data is likely to arrive like this then some sort of pre-processing within the source system would be necessary to ensure that each record is a contiguous block before being forwarded to stroom.
The other main limitation of the parser is actually its flexibility.
If forwarding large streams to stroom and one or more regexes within the parser have been written inefficiently or incorrectly then it’s quite possible for the parser to try to read the entire stream in one go rather than a single record or part of a record.
This will slow down the overall processing and may even cause memory issues in the worst cases.
This is one of the reasons why the stroom team would prefer to be involved in the production of any non-standard parsers as mentioned above.
XSLT
The actual translation takes the XML document produced by the parser and converts it to a new XML document format in what’s known as “stroom schema format”.
The current latest schema is documented at XML Schemas / event-logging / event-logging v3.5.2 within the tree browser.
The version is likely to change over time so you should aim to use the latest non-beta version.
Other Pipeline Elements
The pipeline functionality is flexible in that multiple XSLTs may be used in sequence to add decoration (e.g. Job Title, Grade, Employee type etc. from an HR reference database), schema validation and other business-related tasks.
However, this is outside the scope of this document and pipelines should not be altered unless agreed with the stroom sysadmins.
As an example, we’ve seen instances of people removing schema validation tasks from a pipeline so that processing appears to occur without error.
In practice, this just breaks things further down the processing chain.
Translation Basics
Assuming you have a simple pipeline containing a working parser and an empty XSLT, the output of the parser will look something like this:
<?xml version="1.1" encoding="UTF-8"?>
<records
    xmlns="records:2"
    xmlns:xsi="http://www.w3.org/2001/XMLSchema-instance"
    xsi:schemaLocation="records:2 file://records-v2.0.xsd"
    version="2.0">
  <record>
    <data value="2022-04-06 15:45:38.737" />
    <data value="fakeuser2" />
    <data value="192.168.0.1" />
    <data value="1000011" />
    <data value="200" />
    <data value="Query success" />
    <data value="1" />
  </record>
</records>
The data nodes within the record node will differ as it’s possible to have nested data nodes as well as named data nodes, but for a non-JSON and non-XML fragment source data format, the top-level structure will be similar.
The XSLT needed to recognise and start processing the above example data needs to do several things.
The following initial XSLT provides the minimum required function:
The following lists the necessary functions of the XSLT, along with the line numbers where they’re implemented in the above example:
- Match the source namespace -
line 3;
- Specify the output namespace -
lines 4, 12;
- Specify the namespace for any functions -
lines 5-8;
- Match the top-level records node -
line 10;
- Provide any output in stroom schema format -
lines 11, 14, 18-20;
- Individually match subsequent record nodes -
line 17.
This XSLT will generate the following output data:
<?xml version="1.1" encoding="UTF-8"?>
<Events
    xmlns="event-logging:3"
    xmlns:stroom="stroom"
    xmlns:xsi="http://www.w3.org/2001/XMLSchema-instance"
    xsi:schemaLocation="event-logging:3 file://event-logging-v3.5.2.xsd"
    Version="3.5.2">
  <Event>
    ...
  </Event>
  ...
<Events>
It’s normally best to get this part of the XSLT correctly stepping before getting any further into the code.
Similarly for JSON fragments, the output of the parser will look like:
<?xml version="1.1" encoding="UTF-8"?>
<map xmlns="http://www.w3.org/2013/XSL/json">
  <map>
    <string key="version">0</string>
    <string key="id">2801bbff-fafa-4427-32b5-d38068d3de73</string>
    <string key="detail-type">xyz_event</string>
    <string key="source">my.host.here</string>
    <string key="account">223592823261</string>
    <string key="time">2022-02-15T11:01:36Z</string>
    <array key="resources" />
    <map key="detail">
      <number key="id">1644922894335</number>
      <string key="userId">testuser</string>
    </map>
  </map>
</map>
The following initial XSLT will carry out the same tasks as before:
The necessary functions of the XSLT, along with the line numbers where they’re implemented in the above example as before:
- Match the source namespace -
line 3;
- Specify the output namespace -
lines 4, 12;
- Specify the namespace for any functions -
lines 5-8;
- Match the top-level /map node -
line 10;
- Provide any output in stroom schema format -
lines 11, 14, 18-20;
- Individually match subsequent /map/map nodes -
line 17.
This XSLT will generate the following output data which is identical to the previous output:
<?xml version="1.1" encoding="UTF-8"?>
<Events
    xmlns="event-logging:3"
    xmlns:stroom="stroom"
    xmlns:xsi="http://www.w3.org/2001/XMLSchema-instance"
    xsi:schemaLocation="event-logging:3 file://event-logging-v3.5.2.xsd"
    Version="3.5.2">
  <Event>
    ...
  </Event>
  ...
<Events>
Once the initial XSLT is correct, it’s a fairly simple matter to populate the correct nodes using standard XSLT functions and a knowledge of XPaths.
Extending the Translation to Populate Specific Nodes
The above examples of <xsl:apply-templates match="..."/> for an Event all point to a specific path within the XML document - often at /records/record/ or at /map/map/.
XPath references to nodes further down inside the record should normally be made relative to this node.
Depending on the output format from the parser, there are two ways of referencing a field to populate an output node.
If the intermedia XML is of the following format:
<record>
  <data value="2022-04-06 15:45:38.737" />
  <data value="fakeuser2" />
  <data value="192.168.0.1" />
  ...
</record>
Then the developer needs to understand which field contains what data and then to reference based upon the index, e.g:
<IPAddress>
  <xsl:value-of select="data[3]/@value"/>
</IPAddress>
However, if the intermediate XML is of this format:
<record>
  <data name="time" value="2022-04-06 15:45:38.737" />
  <data name="user" value="fakeuser2" />
  <data name="ip" value="192.168.0.1" />
  ...
</record>
Then, although the first method is still acceptable, it’s easier and safer to reference by @name:
<IPAddress>
  <xsl:value-of select="data[@name='ip']/@value"/>
</IPAddress>
This second method also has the advantage that if the field positions differ for different event types, the names will hopefully stay the same, saving the need to add if TypeA then do X, if TypeB then do Y, ... code into the XSLT.
More complex field references are likely to be required at times, particularly for data that’s been converted using the internal JSON parser.
Assuming source data of:
<map>
  <string key="version">0</string>
  ...
  <array key="resources" />
  <map key="detail">
    <number key="id">1644922894335</number>
    <string key="userId">testuser</string>
  </map>
</map>
Then selecting the id field requires something like:
<xsl:value-of select="map[@key='detail']/number[@key='id']"/>
It’s important at this stage to have a reasonable understanding of which fields in the source data provide what detail in terms of stroom schema values, which fields can be ignored and which can be used but modified to control the flow of the translation.
For example - there may be an IP address within the log, but is it of the device itself or of the client?
It’s normally best to start with several examples of each event type requiring translation to ensure that fields are translated correctly.
Structuring the XSLT
There are many different ways of structuring the overall XSLT and it’s ultimately for the developer to decide the best way based upon the requirements of their own data.
However, the following points should be noted:
- When working on e.g a CreateDocument event, it’s far easier to edit a 10-line template named CreateDocument than lines 841-850 of a template named MainTemplate.
Therefore, keep each template relatively small and helpfully named.
- Both the logic and XPaths required for EventTime and EventSource are normally common to all or most events for a given log.
Therefore, it usually makes sense to have a common EventTime and EventSource template for all event types rather than a duplicate of this code for each event type.
- If code needs to be repeated in multiple templates, then it’s often simpler to move that code into a separate template and call it from multiple places.
This is often used for e.g. adding an Outcome node for multiple failed event types.
- Use comments within the XSLT even when the code appears obvious.
If nothing else, a comment field will ensure a newline prior to the comment once auto-formatted.
This allows the end of one template and the start of the next template to be differentiated more easily if each template is prefixed by something like
<!-- Template for EventDetail -->.
Comments are also useful for anybody who needs to fix your code several years later when you’ve moved on to far more interesting work.
- For most feeds, the main development work is within the EventDetail node.
This will normally contain a lot of code effectively doing
if CreateDocument do X; if DeleteFile do Y; if SuccessfulLogin do Z; ....
From experience, the following type of XSLT is normally the easiest to write and to follow:
  <!-- Event Detail template -->
  <xsl:template name="EventDetail">
    <xsl:variable name="typeId" select="..."/>
      <EventDetail>
        <xsl:choose>
          <xsl:when test="$typeId='A'">
            <xsl:call-template name="Logon"/>
          </xsl:when>
          <xsl:when test="$typeId='B'">
            <xsl:call-template name="CreateDoc"/>
          </xsl:when>
          ...
        </xsl:choose>
      </EventDetail>
    </xsl:template>
- If in the above example, the various values of
$typeId are sufficiently descriptive to use as text values then the TypeId node can be implemented prior to the <xsl:choose> to avoid specifying it once in each child template.
- It’s common for systems to generate
Create/Delete/View/Modify/... events against a range of different Document/File/Email/Object/... types.
Rather than looking at events such as CreateDocument/DeleteFile/... and creating a template for each, it’s often simpler to work in two stages.
Firstly create templates for the Create/Delete/... types within EventDetail and then from each of these templates, call another template which then checks and calls the relevant object template.
- It’s also sometimes possible to take the above multi-step process further and use a common template for Create/Delete/View.
The following code assumes that the variable
${evttype} is a valid schema action such as Create/Delete/View.
Whilst it can be used to produce more compact XSLT code, it tends to lose readability and makes extending the code for additional types more difficult.
The inner <xsl:choose> can even be simplified again by populating an <xsl:element> with {objType} to make the code even more compact and more difficult to follow.
There may occasionally be times when this sort of thing is useful but care should be taken to use it sparingly and provide plenty of comments.
  <xsl:variable name="evttype" select="..."/>
  <xsl:element name="${evttype}">
    <xsl:choose>
      <xsl:when test="objType='Document'">
        <xsl:call-template name="Document"/>
      </xsl:when>
      <xsl:when test="objType='File'">
        <xsl:call-template name="File"/>
      </xsl:when>
      ...
    </xsl:choose>
  </xsl:element>
There are always exceptions to the above advice.
If a feed will only ever contain e.g. successful logins then it may be easier to create the entire event within a single template, for example.
But if there’s ever a possibility of e.g. logon failures, logoffs or anything else in the future then it’s safer to structure the XSLT into separate templates.
Filtering Wanted/Unwanted Event Types
It’s common that not all received events are required to be translated. Depending upon the data being received and the auditing requirements that have been set against the source system, there are several ways to filter the events.
Remove Unwanted Events
The first method is best to use when the majority of event types are to be translated and only a few types, such as debug messages are to be dropped.
Consider the code fragment from earlier:
<xsl:template match="record">
  <Event>
    ...
  </Event>
</xsl:template>
This will create an Event node for every source record.
However, if we replace this with something like:
<xsl:template match="record[data[@name='logLevel' and @value='DEBUG']]"/>

<xsl:template match="record[data[@name='msgType'
                                 and (@value='drop1' or @value='drop2')
                                ]]"/>

<xsl:template match="record">
  <Event>
    ...
  </Event>
</xsl:template>
This will filter out all DEBUG messages and messages where the msgType is either “drop1" or “drop2".
All other messages will result in an Event being generated.
This method is often not suited to systems where the full set of message types isn’t known prior to translation development, such as for closed source software where the full set of possible messages isn’t already known.
If an unexpected message type appears in the logs then it’s likely that the translation won’t know how to deal with it and may either make incorrect assumptions about it or fail to produce a schema-compliant output.
Translate Wanted Events
This is the opposite of the previous method and the XSLT just ignores anything that it’s not expecting.
This method is best used where only a few event types are of interest such as the scenario of translation logons/logoffs from a vast range of possible types.
For this, we’d use something like:
<xsl:template match="record[data[@name='msgType'
                                   and (@value='logon' or @value='logoff')
                                  ]]">
  <Event>
    ...
  </Event>
</xsl:template>

<xsl:template match="text()"/>
The final line stops the XSLT outputting a sequence of unformatted text nodes for any unmatched event types when an <xsl:apply-templates/> is used elsewhere within the XSLT.
It isn’t always needed but does no harm if present.
This method starts to become messy and difficult to understand if a large number of wanted types are to be matched.
Advanced Removal Method (With Optional Warnings)
Where the full list of event types isn’t known or may expand over time, the best method may be to filter out the definite unwanted events and handle anything unexpected as well as the known and wanted events.
This would use code similar to before to drop the specific unwanted types but handle everything else including unknown types:
<xsl:template match="record[data[@name='logLevel' and @value='DEBUG']]"/>
...
<xsl:template match="record[data[@name='msgType'
                                   and (@value='drop1' or @value='drop2')
                                  ]]"/>

<xsl:template match="record">
  <Event>
    ...
  </Event>
</xsl:template>
However, the XSLT must then be able to handle unknown arbitrary event types.
In practice, most systems provide a consistent format for logging the “who/where/when" and it’s only the “what" that differs between event types.
Therefore, it’s usually possible to add something like this into the XSLT:
<EventDetail>
  <xsl:choose>
    <xsl:when test="$evtType='1'">
      ...
    </xsl:when>
    ...
    <xsl:when test="$evtType='n'">
      ...
    </xsl:when>
    <!-- Unknown event type -->
    <xsl:otherwise>
      <Unknown>
        <xsl:value-of select="stroom:log(‘WARN',concat('Unexpected Event Type - ', $evtType))"/>
        ...
      </Unknown>
    </xsl:otherwise>
</EventDetail>
This will create an Event of type Unknown.
The Unknown node is only able to contain data name/value pairs and it should be simple to extract these directly from the intermediate XML using an <xsl:for-each>.
This will allow the attributes from the source event to populate the output event for later analysis but will also generate an error stream of level WARN which will record the event type.
Looking through these error streams will allow the developer to see which unexpected events have appeared then either filter them out within a top-level <xsl:template match="record[data[@name='...' and @value='...']]"/> statement or to produce an additional <xsl:when> within the EventDetail node to translate the type correctly.
Common Mistakes
The way that the code is written can affect its overall performance.
This may not matter for low-volume logs but can greatly affect processing time for higher volumes.
Consider the following example:
<!-- Event Detail template -->
<xsl:template name="EventDetail">
  <xsl:variable name="X" select="..."/>
  <xsl:variable name="Y" select="..."/>
  <xsl:variable name="Z" select="..."/>

  <EventDetail>
    <xsl:choose>
      <xsl:when test="$X='A' and $Y='foo' and matches($Z,'blah.*blah')">
        <xsl:call-template name="AAA"/>
      </xsl:when>
      <xsl:when test="$X='B' or $Z='ABC'">
        <xsl:call-template name="BBB"/>
      </xsl:when>
      ...
      <xsl:otherwise>
        <xsl:call-template name="ZZZ"/>
      </xsl:otherwise>
    </xsl:choose>
  </EventDetail>
</xsl:template>
If none of the <xsl:when> choices match, particularly if there are many of them or their logic is complex then it’ll take a significant time to reach the <xsl:otherwise> element.
If this is by far the most common type of source data (i.e. none of the specific <xsl:when> elements is expected to match very often) then the XSLT will be slow and inefficient.
It’s therefore better to list the most common examples first, if known.
It’s also usually better to have a hierarchy of smaller numbers of options within an <xsl:choose>.
So rather than the above code, the following is likely to be more efficient:
<xsl:choose>
  <xsl:when test="$X='A'">
    <xsl:choose>
      <xsl:when test="$Y='foo'">
        <xsl:choose>
          <xsl:when test="matches($Z,'blah.*blah')">
            <xsl:call-template name="AAA"/>
          </xsl:when>
          <xsl:otherwise>
            ...
          </xsl:otherwise>
        </xsl:choose>
      </xsl:when>
      ...
    </xsl:choose>
    ...
  </xsl:when>
  ...
</xsl:choose>
Whilst this code looks more complex, it’s far more efficient to carry out a shorter sequence of checks, each based upon the result of the previous check, rather than a single consecutive list of checks where the data may only match the final check.
Where possible, the most commonly appearing choices in the source data should be dealt with first to avoid running through multiple <xsl:when> statements.
Stepping Works Fine But Errors Whilst Processing
When data is being stepped, it’s only ever fed to the XSLT as a single event, whilst a pipeline is able to process multiple events within a single input stream.
This apparently minor difference sometimes results in obscure errors if the translation has incorrect XPaths specified.
Taking the following input data example:
<TopLevelNode>
  <EventNode>
    <Field1>1</Field1>
    ...
  </EventNode>
  <EventNode>
    <Field1>2</Field1>
    ...
  </EventNode>
  ...
  <EventNode>
    <Field1>n</Field1>
    ...
  </EventNode>
</TopLevelNode>
If an XSLT is stepped, all XPaths will be relative to <EventNode>.
To extract the value of Field1, you’d use something similar to <xsl:value-of select="Field1"/>.
The following examples would also work in stepping mode or when there was only ever one Event per input stream:
<xsl:value-of select="//Field1"/>
<xsl:value-of select="../EventNode/Field1"/>
<xsl:value-of select="../*/Field1"/>
<xsl:value-of select="/TopLevelNode/EventNode/Field1"/>
However, if there’s ever a stream with multiple event nodes, the output from pipeline processing would be a sequence of the Field1 node values i.e. 12...n for each event.
Whilst it’s easy to spot the issues in these basic examples, it’s harder to see in more complex structures.
It’s also worth mentioning that just because your test data only ever has a single event per stream, there’s nothing to say it’ll stay this way when operational or when the next version of the software is installed on the source system, so you should always guard against using XPaths that go to the root of the tree.
Unexpected Data Values Causing Schema Validation Errors
A source system may provide a log containing an IP address.
All works fine for a while with the following code fragment:
<Client>
  <IPAddress>
    <xsl:value-of select="$ipAddress"/>
  </IPAddress>
</Client>
However, let’s assume that in certain circumstances (e.g. when accessed locally rather than over a network) the system provides a value of localhost or something else that’s not an IP address.
Whilst the majority of schema values are of type string, there are still many that are limited in character set in some way.
The most common is probably IPAddress and it must match a fairly complex regex to be valid.
In this instance, the translation will still succeed but any schema validation elements within the pipeline will throw an error and stop the invalid event (not just the invalid element) from being output within the Events stream.
Without the event in the stream, it’s not indexable or searchable so is effectively dropped by the system.
To resolve this issue, the XSLT should be aware of the possibility of invalid input using something like the following:
<Client>
  <xsl:choose>
    <xsl:when test="matches($ipAddress,'^[.0-9]+$')">
      <IPAddress>
        <xsl:value-of select="$ipAddress"/>
      </IPAddress>
    </xsl:when>
    <xsl:otherwise>
      <HostName>
        <xsl:value-of select="$ipAddress"/>
      </HostName>
    </xsl:otherwise>
  </xsl:choose>
</Client>
This would need to be modified slightly for IPv6 and also wouldn’t catch obvious errors such as 999.1..8888 but if we can assume that the source will generate either a valid IP address or a valid hostname then the events will at least be available within the output stream.
Testing the Translation
When stepping a stream with more than a few events in it, it’s possible to filter the stepping rather than just moving to first/previous/next/last.
In the bottom right hand corner of the bottom right hand pane within the XSLT tab, there’s a small filter icon
 that’s often not spotted.
The icon will be grey if no filter is set or green if set.
Opening this filter gives choices such as:
- Jump to error
- Jump to empty/non-empty output
- Jump to specific XPath exists/contains/equals/unique
Each of these options can be used to move directly to the next/previous event that matches one of these attributes.
A filter on e.g. the
 xsltFilter
will still be active even if viewing the
 dsParser
or any other pipeline entry, although the filter that’s present in the parser step will not show any values.
This may cause confusion if you lose track of which filters have been set on which steps.
Filters can be entered for multiple pipeline elements, e.g. Empty output in translationFilter and Error in schemaFilter.
In this example, all empty outputs AND schema errors will be seen, effectively providing an OR of the filters.
The XPath syntax is fairly flexible.
If looking for specific TypeId values, the shortcut of //TypeId will work just as well as /Events/Event/EventDetail/TypeId, for example.
Using filters will allow a developer to find a wide range of types of records far quicker than stepping through a large file of events.
5.2 - Apache HTTPD Event Feed
The following will take you through the process of creating an Event Feed in Stroom.
Introduction
The following will take you through the process of creating an Event Feed in Stroom.
In this example, the logs are in a well-defined, line based, text format so we will use a Data Splitter parser to transform the logs into simple record-based XML and then a XSLT translation to normalise them into the Event schema.
A separate document will describe the method of automating the storage of normalised events for this feed.
Further, we will not Decorate these events.
Again, Event Decoration is described in another document.
Event Log Source
For this example, we will use logs from an Apache HTTPD Web server.
In fact, the web server in front of Stroom v5 and earlier.
To get the optimal information from the Apache HTTPD access logs, we define our log format based on an extension of the BlackBox format.
The format is described and defined below.
This is an extract from a httpd configuration file (/etc/httpd/conf/httpd.conf)
# Stroom - Black Box Auditing configuration
#
# %a - Client IP address (not hostname (%h) to ensure ip address only)
# When logging the remote host, it is important to log the client IP address, not the
# hostname. We do this with the '%a' directive. Even if HostnameLookups are turned on,
# using '%a' will only record the IP address. For the purposes of BlackBox formats,
# reversed DNS should not be trusted

# %{REMOTE_PORT}e - Client source port
# Logging the client source TCP port can provide some useful network data and can help
# one associate a single client with multiple requests.
# If two clients from the same IP address make simultaneous connections, the 'common log'
# file format cannot distinguish between those clients. Otherwise, if the client uses
# keep-alives, then every hit made from a single TCP session will be associated by the same
# client port number.
# The port information can indicate how many connections our server is handling at once,
# which may help in tuning server TCP/OP settings. It will also identify which client ports
# are legitimate requests if the administrator is examining a possible SYN-attack against a
# server.
# Note we are using the REMOTE_PORT environment variable. Environment variables only come
# into play when mod_cgi or mod_cgid is handling the request.

# %X - Connection status (use %c for Apache 1.3)
# The connection status directive tells us detailed information about the client connection.
# It returns one of three flags:
# x if the client aborted the connection before completion,
# + if the client has indicated that it will use keep-alives (and request additional URLS),
# - if the connection will be closed after the event
# Keep-Alive is a HTTP 1.1. directive that informs a web server that a client can request multiple
# files during the same connection. This way a client doesn't need to go through the overhead
# of re-establishing a TCP connection to retrieve a new file.

# %t - time - or [%{%d/%b/%Y:%T}t.%{msec_frac}t %{%z}t] for Apache 2.4
# The %t directive records the time that the request started.
# NOTE: When deployed on an Apache 2.4, or better, environment, you should use
# strftime format in order to get microsecond resolution.

# %l - remote logname

# %u - username [in quotes]
# The remote user (from auth; This may be bogus if the return status (%s) is 401
# for non-ssl services)
# For SSL services, user names need to be delivered as DNs to deliver PKI user details
# in full. To pass through PKI certificate properties in the correct form you need to
# add the following directives to your Apache configuration:
#   SSLUserName SSL_CLIENT_S_DN
#   SSLOptions +StdEnvVars
# If you cannot, then use %{SSL_CLIENT_S_DN}x in place of %u and use blackboxSSLUser
# LogFormat nickname

# %r - first line of text sent by web client [in quotes]
# This is the first line of text send by the web client, which includes the request
# method, the full URL, and the HTTP protocol.

# %s - status code before any redirection
# This is the status code of the original request.

# %>s - status code after any redirection has taken place
# This is the final status code of the request, after any internal redirections may
# have taken place.

# %D - time in microseconds to handle the request
# This is the number of microseconds the server took to handle the request in microseconds

# %I - incoming bytes
# This is the bytes received, include request and headers. It cannot, by definition be zero.

# %O - outgoing bytes
# This is the size in bytes of the outgoing data, including HTTP headers. It cannot, by
# definition be zero.

# %B - outgoing content bytes
# This is the size in bytes of the outgoing data, EXCLUDING HTTP headers. Unlike %b, which
# records '-' for zero bytes transferred, %B will record '0'.

# %{Referer}i - Referrer HTTP Request Header [in quotes]
# This is typically the URL of the page that made the request. If linked from
# e-mail or direct entry this value will be empty. Note, this can be spoofed
# or turned off

# %{User-Agent}i - User agent HTTP Request Header [in quotes]
# This is the identifying information the client (browser) reports about itself.
# It can be spoofed or turned off

# %V - the server name according to the UseCannonicalName setting
# This identifies the virtual host in a multi host webservice

# %p - the canonical port of the server servicing the request

# Define a variation of the Black Box logs
#
# Note, you only need to use the 'blackboxSSLUser' nickname if you cannot set the
# following directives for any SSL configurations
# SSLUserName SSL_CLIENT_S_DN
# SSLOptions +StdEnvVars
# You will also note the variation for no logio module. The logio module supports
# the %I and %O formatting directive
#
<IfModule mod_logio.c>
   LogFormat "%a/%{REMOTE_PORT}e %X %t %l \"../../"%r\" %s/%>s %D %I/%O/%B \"%{Referer}i\" \"%{User-Agent}i\" %V/%p" blackboxUser
   LogFormat "%a/%{REMOTE_PORT}e %X %t %l \"%{SSL_CLIENT_S_DN../../"%r\" %s/%>s %D %I/%O/%B \"%{Referer}i\" \"%{User-Agent}i\" %V/%p" blackboxSSLUser
</IfModule>
<IfModule !mod_logio.c>
   LogFormat "%a/%{REMOTE_PORT}e %X %t %l \"../../"%r\" %s/%>s %D 0/0/%B \"%{Referer}i\" \"%{User-Agent}i\" %V/$p" blackboxUser
   LogFormat "%a/%{REMOTE_PORT}e %X %t %l \"%{SSL_CLIENT_S_DN../../"%r\" %s/%>s %D 0/0/%B \"%{Referer}i\" \"%{User-Agent}i\" %V/$p" blackboxSSLUser
</IfModule>
Apache BlackBox Auditing Configuration
(
Download ApacheHTTPDAuditConfig.txt
)
As Stroom can use PKI for login, you can configure Stroom’s Apache to make use of the blackboxSSLUser log format.
A sample set of logs in this format appear below.
192.168.4.220/61801 - [18/Jan/2020:12:39:04 -0800] - "/C=USA/ST=CA/L=Los Angeles/O=Default Company Ltd/CN=Burn Frank (burn)" "POST /stroom/stroom/dispatch.rpc HTTP/1.1" 200/200 21221 2289/415/14 "https://stroomnode00.strmdev00.org/stroom/" "Mozilla/5.0 (Windows NT 10.0; Win64; x64) AppleWebKit/537.36 (KHTML, like Gecko) Chrome/81.0.4044.113 Safari/537.36" stroomnode00.strmdev00.org/443
192.168.4.220/61854 - [18/Jan/2020:12:40:04 -0800] - "/C=USA/ST=CA/L=Los Angeles/O=Default Company Ltd/CN=Burn Frank (burn)" "POST /stroom/stroom/dispatch.rpc HTTP/1.1" 200/200 7889 2289/415/14 "https://stroomnode00.strmdev00.org/stroom/" "Mozilla/5.0 (Windows NT 10.0; Win64; x64) AppleWebKit/537.36 (KHTML, like Gecko) Chrome/81.0.4044.113 Safari/537.36" stroomnode00.strmdev00.org/443
192.168.4.220/61909 - [18/Jan/2020:12:41:04 -0800] - "/C=USA/ST=CA/L=Los Angeles/O=Default Company Ltd/CN=Burn Frank (burn)" "POST /stroom/stroom/dispatch.rpc HTTP/1.1" 200/200 6901 2389/3796/14 "https://stroomnode00.strmdev00.org/stroom/" "Mozilla/5.0 (Windows NT 10.0; Win64; x64) AppleWebKit/537.36 (KHTML, like Gecko) Chrome/81.0.4044.113 Safari/537.36" stroomnode00.strmdev00.org/443
192.168.4.220/61962 - [18/Jan/2020:12:42:04 -0800] - "/C=USA/ST=CA/L=Los Angeles/O=Default Company Ltd/CN=Burn Frank (burn)" "POST /stroom/stroom/dispatch.rpc HTTP/1.1" 200/200 11219 2289/415/14 "https://stroomnode00.strmdev00.org/stroom/" "Mozilla/5.0 (Windows NT 10.0; Win64; x64) AppleWebKit/537.36 (KHTML, like Gecko) Chrome/81.0.4044.113 Safari/537.36" stroomnode00.strmdev00.org/443
192.168.8.151/62015 - [18/Jan/2020:12:43:04 +1100] - "/C=AUS/ST=NSW/L=Sydney/O=Default Company Ltd/CN=Max Bergman (maxb)" "POST /stroom/stroom/dispatch.rpc HTTP/1.1" 200/200 4265 2289/415/14 "https://stroomnode00.strmdev00.org/stroom/" "Mozilla/5.0 (Windows NT 10.0; Win64; x64) AppleWebKit/537.36 (KHTML, like Gecko) Chrome/81.0.4044.113 Safari/537.36" stroomnode00.strmdev00.org/443
192.168.8.151/62092 - [18/Jan/2020:12:44:04 +1100] - "/C=AUS/ST=NSW/L=Sydney/O=Default Company Ltd/CN=Max Bergman (maxb)" "POST /stroom/stroom/dispatch.rpc HTTP/1.1" 200/200 9791 2289/415/14 "https://stroomnode00.strmdev00.org/stroom/" "Mozilla/5.0 (Windows NT 10.0; Win64; x64) AppleWebKit/537.36 (KHTML, like Gecko) Chrome/81.0.4044.113 Safari/537.36" stroomnode00.strmdev00.org/443
192.168.8.151/62147 - [18/Jan/2020:12:44:10 +1100] - "/C=AUS/ST=NSW/L=Sydney/O=Default Company Ltd/CN=Max Bergman (maxb)" "POST /stroom/stroom/dispatch.rpc HTTP/1.1" 200/200 9791 2289/415/14 "https://stroomnode00.strmdev00.org/stroom/" "Mozilla/5.0 (Windows NT 10.0; Win64; x64) AppleWebKit/537.36 (KHTML, like Gecko) Chrome/81.0.4044.113 Safari/537.36" stroomnode00.strmdev00.org/443
192.168.8.151/62147 - [18/Jan/2020:12:44:20 +1100] - "/C=AUS/ST=NSW/L=Sydney/O=Default Company Ltd/CN=Max Bergman (maxb)" "POST /stroom/stroom/dispatch.rpc HTTP/1.1" 200/200 11509 2289/415/14 "https://stroomnode00.strmdev00.org/stroom/" "Mozilla/5.0 (Windows NT 10.0; Win64; x64) AppleWebKit/537.36 (KHTML, like Gecko) Chrome/81.0.4044.113 Safari/537.36" stroomnode00.strmdev00.org/443
192.168.8.151/62202 - [18/Jan/2020:12:44:21 +1100] - "/C=AUS/ST=NSW/L=Sydney/O=Default Company Ltd/CN=Max Bergman (maxb)" "POST /stroom/stroom/dispatch.rpc HTTP/1.1" 200/200 4627 2389/3796/14 "https://stroomnode00.strmdev00.org/stroom/" "Mozilla/5.0 (Windows NT 10.0; Win64; x64) AppleWebKit/537.36 (KHTML, like Gecko) Chrome/81.0.4044.113 Safari/537.36" stroomnode00.strmdev00.org/443
192.168.8.151/62294 - [18/Jan/2020:12:44:21 +1100] - "/C=AUS/ST=NSW/L=Sydney/O=Default Company Ltd/CN=Max Bergman (maxb)" "POST /stroom/stroom/dispatch.rpc HTTP/1.1" 200/200 12367 2289/415/14 "https://stroomnode00.strmdev00.org/stroom/" "Mozilla/5.0 (Windows NT 10.0; Win64; x64) AppleWebKit/537.36 (KHTML, like Gecko) Chrome/81.0.4044.113 Safari/537.36" stroomnode00.strmdev00.org/443
192.168.8.151/62349 - [18/Jan/2020:12:44:25 +1100] - "/C=AUS/ST=NSW/L=Sydney/O=Default Company Ltd/CN=Max Bergman (maxb)" "POST /stroom/stroom/dispatch.rpc HTTP/1.1" 200/200 12765 2289/415/14 "https://stroomnode00.strmdev00.org/stroom/" "Mozilla/5.0 (Windows NT 10.0; Win64; x64) AppleWebKit/537.36 (KHTML, like Gecko) Chrome/81.0.4044.113 Safari/537.36" stroomnode00.strmdev00.org/443
192.168.234.9/62429 - [18/Jan/2020:12:50:06 +0000] - "/C=GBR/ST=GLOUCESTERSHIRE/L=Bristol/O=Default Company Ltd/CN=Kostas Kosta (kk)" "POST /stroom/stroom/dispatch.rpc HTTP/1.1" 200/200 12245 2289/415/14 "https://stroomnode00.strmdev00.org/stroom/" "Mozilla/5.0 (Windows NT 10.0; Win64; x64) AppleWebKit/537.36 (KHTML, like Gecko) Chrome/81.0.4044.113 Safari/537.36" stroomnode00.strmdev00.org/443
192.168.234.9/62429 - [18/Jan/2020:12:50:04 +0000] - "/C=GBR/ST=GLOUCESTERSHIRE/L=Bristol/O=Default Company Ltd/CN=Kostas Kosta (kk)" "POST /stroom/stroom/dispatch.rpc HTTP/1.1" 200/200 12245 2289/415/14 "https://stroomnode00.strmdev00.org/stroom/" "Mozilla/5.0 (Windows NT 10.0; Win64; x64) AppleWebKit/537.36 (KHTML, like Gecko) Chrome/81.0.4044.113 Safari/537.36" stroomnode00.strmdev00.org/443
192.168.234.9/62495 - [18/Jan/2020:12:51:04 +0000] - "/C=GBR/ST=GLOUCESTERSHIRE/L=Bristol/O=Default Company Ltd/CN=Kostas Kosta (kk)" "POST /stroom/stroom/dispatch.rpc HTTP/1.1" 200/200 4327 2289/415/14 "https://stroomnode00.strmdev00.org/stroom/" "Mozilla/5.0 (Windows NT 10.0; Win64; x64) AppleWebKit/537.36 (KHTML, like Gecko) Chrome/81.0.4044.113 Safari/537.36" stroomnode00.strmdev00.org/443
192.168.234.9/62549 - [18/Jan/2020:12:52:04 +0000] - "/C=GBR/ST=GLOUCESTERSHIRE/L=Bristol/O=Default Company Ltd/CN=Kostas Kosta (kk)" "POST /stroom/stroom/dispatch.rpc HTTP/1.1" 200/200 7148 2289/415/14 "https://stroomnode00.strmdev00.org/stroom/" "Mozilla/5.0 (Windows NT 10.0; Win64; x64) AppleWebKit/537.36 (KHTML, like Gecko) Chrome/81.0.4044.113 Safari/537.36" stroomnode00.strmdev00.org/443
192.168.234.9/62626 - [18/Jan/2020:12:52:06 +0000] - "/C=GBR/ST=GLOUCESTERSHIRE/L=Bristol/O=Default Company Ltd/CN=Kostas Kosta (kk)" "POST /stroom/stroom/dispatch.rpc HTTP/1.1" 200/200 11386 2289/415/14 "https://stroomnode00.strmdev00.org/stroom/" "Mozilla/5.0 (Windows NT 10.0; Win64; x64) AppleWebKit/537.36 (KHTML, like Gecko) Chrome/81.0.4044.113 Safari/537.36" stroomnode00.strmdev00.org/443
Save a copy of this data to your local environment for use later in this HOWTO.
Save this file as a text document with ANSI encoding.
Create the Feed and its Pipeline
To reflect the source of these Accounting Logs, we will name our feed and its pipeline Apache-SSLBlackBox-V2.0-EVENTS and it will be stored in the system group Apache HTTPD under the main system group - Event Sources.
Create System Group
To create the system group Apache HTTPD, navigate to the Event Sources/Infrastructure/WebServer system group within the Explorer pane (if this system group structure does not already exist in your Stroom instance then refer to the HOWTO Stroom Explorer Management for guidance).
Left click to highlight the
WebServer system group then right click to bring up the object context menu.
Navigate to the New icon, then the Folder icon to reveal the New Folder selection window.
In the New Folder window enter Apache HTTPD into the Name: text entry box.
The click on
Ok
at which point you will be presented with the Apache HTTPD system group configuration tab.
Also note, the WebServer system group within the Explorer pane has automatically expanded to display the Apache HTTPD system group.
Close the Apache HTTPD system group configuration tab by clicking on the close item icon on the right-hand side of the tab
 Apache HTTPD
×
.
We now need to create, in order
- the Feed,
- the Text Parser,
- the Translation and finally,
- the Pipeline.
Create Feed
Within the Explorer pane, and having selected the Apache HTTPD group, right click to bring up object context menu.
Navigate to New, Feed
Select the Feed icon
 , when the New Feed selection window comes up, ensure the
 Apache HTTPD system group is selected or navigate to it.
Then enter the name of the feed, Apache-SSLBlackBox-V2.0-EVENTS, into the Name: text entry box the press
Ok
.
It should be noted that the default Stroom FeedName pattern will not accept this name.
One needs to modify the stroom.feedNamePattern stroom property to change the default pattern to ^[a-zA-Z0-9_-\.]{3,}$.
See the HOWTO on System Properties document to see how to make this change.
At this point you will be presented with the new feed’s configuration tab and the feed’s Explorer object will automatically appear in the Explorer pane within the Apache HTTPD system group.
Select the Settings tab on the feed’s configuration tab.
Enter an appropriate description into the Description: text entry box, for instance:
“Apache HTTPD events for BlackBox Version 2.0. These events are from a Secure service (https).”
In the Classification: text entry box, enter a Classification of the data that the event feed will contain - that is the classification or sensitivity of the accounting log’s content itself.
As this is not a Reference Feed, leave the Reference Feed: check box unchecked.
We leave the Feed Status: at Receive.
We leave the Stream Type: as Raw Events as this we will be sending batches (streams) of raw event logs.
We leave the Data Encoding: as UTF-8 as the raw logs are in this form.
We leave the Context Encoding: as UTF-8 as there no context events for this feed.
We leave the Retention Period: at Forever as we do not want to delete the raw logs.
This results in
Save the feed by clicking on the save icon
 .
.
Create Text Converter
Within the Explorer pane, and having selected the Apache HTTPD system group, right click to bring up object context menu, then select:
 New =>
 Text Converter
When the New Text Converter
selection window comes up enter the name of the feed, Apache-SSLBlackBox-V2.0-EVENTS, into the Name: text entry box then press
Ok
.
At this point you will be presented with the new text converter’s configuration tab.
Enter an appropriate description into the Description: text entry box, for instance
“Apache HTTPD events for BlackBox Version 2.0 - text converter.
See Conversion for complete documentation.”
Set the Converter Type: to be Data Splitter from drop down menu.
Save the text converter by clicking on the save icon
 .
.
Create XSLT Translation
Within the Explorer pane, and having selected the Apache HTTPD system group, right click to bring up object context menu, then select:
 New =>
 XSLT
XSLT
When the New XSLT selection window comes up,
enter the name of the feed, Apache-SSLBlackBox-V2.0-EVENTS, into the Name: text entry box then press
Ok
.
At this point you will be presented with the new XSLT’s configuration tab.
Enter an appropriate description into the Description: text entry box, for instance
“Apache HTTPD events for BlackBox Version 2.0 - translation.
See Translation for complete documentation.”
Save the XSLT by clicking on the save
 icon.
icon.
Create Pipeline
In the process of creating this pipeline we have assumed that the Template Pipeline content pack has been loaded, so that we can Inherit a pipeline structure from this content pack and configure it to support this specific feed.
Within the Explorer pane, and having selected the Apache HTTPD system group, right click to bring up object context menu, then select:
 New =>
 Pipeline
When the New Pipeline selection window comes up, navigate to, then select the Apache HTTPD system group and then enter the name of the pipeline, Apache-SSLBlackBox-V2.0-EVENTS
into the Name: text entry box then press
Ok
.
At this you will be presented with the new pipeline’s configuration tab
As usual, enter an appropriate Description:
“Apache HTTPD events for BlackBox Version 2.0 - pipeline.
This pipeline uses the standard event pipeline to store the events in the Event Store.”
Save the pipeline by clicking on the save icon
 .
.
We now need to select the structure this pipeline will use.
We need to move from the Settings sub-item on the pipeline configuration tab to the Structure sub-item.
This is done by clicking on the Structure link, at which we see
Next we will choose an Event Data pipeline.
This is done by inheriting it from a defined set of Template Pipelines.
To do this, click on the menu selection icon to the right of the Inherit From: text display box.
When the Choose item
selection window appears, select from the Template Pipelines system group.
In this instance, as our input data is text, we select (left click) the
 Event Data (Text) pipeline
then press
Ok
.
At this we see the inherited pipeline structure of
For the purpose of this HOWTO, we are only interested in two of the eleven (11) elements in this pipeline
- the Text Converter labelled dsParser
- the XSLT Translation labelled translationFilter
We now need to associate our Text Converter and Translation with the pipeline so that we can pass raw events (logs) through our pipeline in order to save them in the Event Store.
To associate the Text Converter, select the Text Converter icon, to display.
Now identify to the Property pane (the middle pane of the pipeline configuration tab), then and double click on the textConverter Property Name to display the Edit
Property selection window that allows you to edit the given property
We leave the Property Source: as Inherit but we need to change the Property Value: from None to be our newly created Apache-SSLBlackBox-V2.0-EVENTS Text Converter.
To do this, position the cursor over the menu selection icon
 to the right of the Value: text display box and click to select.
Navigate to the
 Apache HTTPD system group then select the Apache-SSLBlackBox-V2.0-EVENTS text Converter
then press
Ok
.
At this we will see the Property Value set
Again press
Ok
to finish editing this property and we see that the textConverter Property has been set to Apache-SSLBlackBox-V2.0-EVENTS
We perform the same actions to associate the translation.
First, we select the translation Filter’s
 translationFilter
element and then within translation Filter’s Property pane we double click on the xslt Property Name to bring up the Property Editor.
As before, bring up the Choose item selection window, navigate to the
 Apache HTTPD system group and select the
Apache-SSLBlackBox-V2.0-EVENTS xslt Translation.
We leave the remaining properties in the translation Filter’s Property pane at their default values.
The result is the assignment of our translation to the xslt Property.
For the moment, we will not associate a decoration filter.
Save the pipeline by clicking on its
 icon.
icon.
Manually load Raw Event test data
Having established the pipeline, we can now start authoring our text converter and translation.
The first step is to load some Raw Event test data.
Previously in the Event Log Source of this HOWTO you saved a copy of the file sampleApacheBlackBox.log to your local environment.
It contains only a few events as the content is consistently formatted.
We could feed the test data by posting the file to Stroom’s accounting/datafeed url, but for this example we will manually load the file.
Once developed, raw data is posted to the web service.
Select the
 ApacheHHTPDFeed
×
tab and select the Data sub-tab to display
This window is divided into three panes.
The top pane displays the Stream Table, which is a table of the latest streams that belong to the feed (clearly it’s empty).
Note that a Raw Event stream is made up of data from a single file of data or aggregation of multiple data files and also meta-data associated with the data file(s).
For example, file names, file size, etc.
The middle pane displays a Specific feed and any linked streams.
To display a Specific feed, you select it from the Stream Table above.
The bottom pane displays the selected stream’s data or meta-data.
Note the Upload icon
 in the top left of the Stream table pane.
On clicking the Upload icon, we are presented with the data Upload selection window.
As stated earlier, raw event data is normally posted as a file to the Stroom web server.
As part of this posting action, a set of well-defined HTTP extra headers are sent as part of the post.
These headers, in the form of key value pairs, provide additional context associated with the system sending the logs.
These standard headers become Stroom feed attributes available to the Stroom translation.
Common attributes are
- System - the name of the System providing the logs
- Environment - the environment of the system (Production, Quality Assurance, Reference, Development)
- Feed - the feedname itself
- MyHost - the fully qualified domain name of the system sending the logs
- MyIPaddress - the IP address of the system sending the logs
- MyNameServer - the name server the system resolves names through
Since our translation will want these feed attributes, we will set them in the Meta Data text entry box of the Upload selection window.
Note we can skip Feed as this will automatically be assigned correctly as part of the upload action (setting it to Apache-SSLBlackBox-V2.0-EVENTS obviously).
Our Meta Data: will have
- System:LinuxWebServer
- Environment:Production
- MyHost:stroomnode00.strmdev00.org
- MyIPaddress:192.168.2.245
- MyNameServer:192.168.2.254
We select a Stream Type: of Raw Events as this data is for an Event Feed.
As this is not a Reference Feed we ignore the Effective: entry box (a date/time selector).
We now click the Choose File button, then navigate to the location of the raw log file you downloaded earlier, sampleApacheBlackBox.log
then click Open to return to the Upload selection window where we can then press
Ok
to perform the upload.
An Alert dialog window is presented
which should be
closed.
The stream we have just loaded will now be displayed in the Streams Table pane.
Note that the Specific Stream
and Data/Meta-data panes are still blank.
If we select the stream by clicking anywhere along its line, the stream is highlighted and the Specific Stream and Data/Meta-data_ panes now display data.
The Specific Stream pane only displays the Raw Event stream and the Data/Meta-data pane displays the content of the log file just uploaded (the Data link).
If we were to click on the Meta link at the top of the Data/Meta-data pane, the log data is replaced by this stream’s meta-data.
Note that, in addition to the feed attributes we set, the upload process added additional feed attributes of
- Feed - the feed name
- ReceivedTime - the time the feed was received by Stroom
- RemoteFile - the name of the file loaded
- StreamSize - the size, in bytes, of the loaded data within the stream
- user-agent - the user agent used to present the stream to Stroom - in this case, the Stroom user Interface
We now have data that will allow us to develop our text converter and translation.
Step data through Pipeline - Source
We now need to step our data through the pipeline.
To do this, set the check-box on the Specific Stream pane and we note that the previously grayed out action icons (


 ) are now enabled.
We now want to step our data through the first element of the pipeline, the Text Converter.
We enter Stepping Mode by pressing the stepping button
 found at the bottom right corner of the Data/Meta-data pane.
We will then be requested to choose a pipeline to step with, at which, you should navigate to the Apache-SSLBlackBox-V2.0-EVENTS pipeline as per
then press
Ok
.
At this point, we enter the pipeline Stepping tab
which, initially displays the Raw Event data from our stream.
This is the Source display for the Event Pipeline.
Step data through Pipeline - Text Converter
We click on the
 dsParser
element to enter the Text Converter stepping window.
This stepping tab is divided into three sub-panes.
The top one is the Text Converter editor and it will allow you to edit the text conversion.
The bottom left window displays the input to the Text Converter.
The bottom right window displays the output from the Text Converter for the given input.
We also note an error indicator - that of an error in the editor pane as indicated by the black back-grounded x and rectangular black boxes to the right of the editor’s scroll bar.
In essence, this means that we have no text converter to pass the Raw Event data through.
To correct this, we will author our text converter using the Data Splitter language.
Normally this is done incrementally to more easily develop the parser.
The minimum text converter contains
<?xml version="1.1" encoding="UTF-8"?>
<dataSplitter xmlns="data-splitter:3" xmlns:xsi="http://www.w3.org/2001/XMLSchema-instance" xsi:schemaLocation="data-splitter:3 file://data-splitter-v3.0.1.xsd" version="3.0">
    <split  delimiter="\n">
        <group>
            <regex pattern="^(.*)$">
                <data name="rest" value="$1" />
            </regex>
        </group>
    </split>
</dataSplitter>
If we now press the Step First
 icon the error will disappear and the stepping window will show.
As we can see, the first line of our Raw Event is displayed in the input pane and the output window holds the converted XML output where we just have a single data element with a name attribute of rest and a value attribute of the complete raw event as our regular expression matched the entire line.
The next incremental step in the parser, would be to parse out additional data elements.
For example, in this next iteration we extract the client ip address, the client port and hold the rest of the Event in the rest data element.
With the text converter containing
<?xml version="1.1" encoding="UTF-8"?>
<dataSplitter xmlns="data-splitter:3" xmlns:xsi="http://www.w3.org/2001/XMLSchema-instance" xsi:schemaLocation="data-splitter:3 file://data-splitter-v3.0.1.xsd" version="3.0">
    <split  delimiter="\n">
        <group>
            <regex pattern="^([^/]+)/([^  ]+) (.*)$">
                <data name="clientip"  value="$1" />
                <data name="clientport"  value="$2" />
                <data name="rest" value="$3" />
            </regex>
        </group>
    </split>
</dataSplitter>
and a click on the Refresh Current Step
 icon we will see the output pane contain
We continue this incremental parsing until we have our complete parser.
The following is our complete Text Converter which generates xml records as defined by the Stroom records v3.0 schema.
<?xml version="1.1" encoding="UTF-8"?>
<dataSplitter
xmlns="data-splitter:3"
xmlns:xsi="http://www.w3.org/2001/XMLSchema-instance"
xsi:schemaLocation="data-splitter:3 file://data-splitter-v3.0.1.xsd"
version="3.0">
<!-- CLASSIFICATION: UNCLASSIFIED -->
<!-- Release History:
Release 20131001, 1 Oct 2013 - Initial release
General Notes:
This data splitter takes audit events for the Stroom variant of the Black Box Apache Auditing.
Event Format: The following is extracted from the Configuration settings for the Stroom variant of the Black Box Apache Auditing format.
# Stroom - Black Box Auditing configuration
#
# %a - Client IP address (not hostname (%h) to ensure ip address only)
# When logging the remote host, it is important to log the client IP address, not the
# hostname. We do this with the '%a' directive. Even if HostnameLookups are turned on,
# using '%a' will only record the IP address. For the purposes of BlackBox formats,
# reversed DNS should not be trusted
# %{REMOTE_PORT}e - Client source port
# Logging the client source TCP port can provide some useful network data and can help
# one associate a single client with multiple requests.
# If two clients from the same IP address make simultaneous connections, the 'common log'
# file format cannot distinguish between those clients. Otherwise, if the client uses
# keep-alives, then every hit made from a single TCP session will be associated by the same
# client port number.
# The port information can indicate how many connections our server is handling at once,
# which may help in tuning server TCP/OP settings. It will also identify which client ports
# are legitimate requests if the administrator is examining a possible SYN-attack against a
# server.
# Note we are using the REMOTE_PORT environment variable. Environment variables only come
# into play when mod_cgi or mod_cgid is handling the request.
# %X - Connection status (use %c for Apache 1.3)
# The connection status directive tells us detailed information about the client connection.
# It returns one of three flags:
# x if the client aborted the connection before completion,
# + if the client has indicated that it will use keep-alives (and request additional URLS),
# - if the connection will be closed after the event
# Keep-Alive is a HTTP 1.1. directive that informs a web server that a client can request multiple
# files during the same connection. This way a client doesn't need to go through the overhead
# of re-establishing a TCP connection to retrieve a new file.
# %t - time - or [%{%d/%b/%Y:%T}t.%{msec_frac}t %{%z}t] for Apache 2.4
# The %t directive records the time that the request started.
# NOTE: When deployed on an Apache 2.4, or better, environment, you should use
# strftime format in order to get microsecond resolution.
# %l - remote logname
#
# %u - username [in quotes]
# The remote user (from auth; This may be bogus if the return status (%s) is 401
# for non-ssl services)
# For SSL services, user names need to be delivered as DNs to deliver PKI user details
# in full. To pass through PKI certificate properties in the correct form you need to
# add the following directives to your Apache configuration:
# SSLUserName SSL_CLIENT_S_DN
# SSLOptions +StdEnvVars
# If you cannot, then use %{SSL_CLIENT_S_DN}x in place of %u and use blackboxSSLUser
# LogFormat nickname
# %r - first line of text sent by web client [in quotes]
# This is the first line of text send by the web client, which includes the request
# method, the full URL, and the HTTP protocol.
# %s - status code before any redirection
# This is the status code of the original request.
# %>s - status code after any redirection has taken place
# This is the final status code of the request, after any internal redirections may
# have taken place.
# %D - time in microseconds to handle the request
# This is the number of microseconds the server took to handle the request in microseconds
# %I - incoming bytes
# This is the bytes received, include request and headers. It cannot, by definition be zero.
# %O - outgoing bytes
# This is the size in bytes of the outgoing data, including HTTP headers. It cannot, by
# definition be zero.
# %B - outgoing content bytes
# This is the size in bytes of the outgoing data, EXCLUDING HTTP headers. Unlike %b, which
# records '-' for zero bytes transferred, %B will record '0'.
# %{Referer}i - Referrer HTTP Request Header [in quotes]
# This is typically the URL of the page that made the request. If linked from
# e-mail or direct entry this value will be empty. Note, this can be spoofed
# or turned off
# %{User-Agent}i - User agent HTTP Request Header [in quotes]
# This is the identifying information the client (browser) reports about itself.
# It can be spoofed or turned off
# %V - the server name according to the UseCannonicalName setting
# This identifies the virtual host in a multi host webservice
# %p - the canonical port of the server servicing the request
# Define a variation of the Black Box logs
#
# Note, you only need to use the 'blackboxSSLUser' nickname if you cannot set the
# following directives for any SSL configurations
# SSLUserName SSL_CLIENT_S_DN
# SSLOptions +StdEnvVars
# You will also note the variation for no logio module. The logio module supports
# the %I and %O formatting directive
#
<IfModule mod_logio.c>
LogFormat "%a/%{REMOTE_PORT}e %X %t %l \"%u\" \"%r\" %s/%>s %D I/%O/%B \"%{Referer}i\" \"%{User-Agent}i\" %V/%p" blackboxUser
LogFormat "%a/%{REMOTE_PORT}e %X %t %l \"%{SSL_CLIENT_S_DN}x\" \"%r\" %s/%>s %D %I/%O/%B \"%{Referer}i\" \"%{User-Agent}i\" %V/%p" blackboxSSLUser
</IfModule>
<IfModule !mod_logio.c>
LogFormat "%a/%{REMOTE_PORT}e %X %t %l \"%u\" \"%r\" %s/%>s %D 0/0/%B \"%{Referer}i\" \"%{User-Agent}i\" %V/$p" blackboxUser
LogFormat "%a/%{REMOTE_PORT}e %X %t %l \"%{SSL_CLIENT_S_DN}x\" \"%r\" %s/%>s %D 0/0/%B \"%{Referer}i\" \"%{User-Agent}i\" %V/$p" blackboxSSLUser
</IfModule>
-->
<!-- Match line -->
<split delimiter="\n">
<group>
<regex pattern="^([^/]+)/([^ ]+) ([^ ]+) \[([^\]]+)] ([^ ]+) "([^"]+)" "([^"]+)" (\d+)/(\d+) (\d+) ([^/]+)/([^/]+)/(\d+) "([^"]+)" "([^"]+)" ([^/]+)/([^ ]+)">
<data name="clientip" value="$1" />
<data name="clientport" value="$2" />
<data name="constatus" value="$3" />
<data name="time" value="$4" />
<data name="remotelname" value="$5" />
<data name="user" value="$6" />
<data name="url" value="$7">
<group value="$7" ignoreErrors="true">
<!--
Special case the "GET /" url string as opposed to the more standard "method url protocol/protocol_version".
Also special case a url of "-" which occurs on some errors (eg 408)
-->
<regex pattern="^-$">
<data name="url" value="error" />
</regex>
<regex pattern="^([^ ]+) (/)$">
<data name="httpMethod" value="$1" />
<data name="url" value="$2" />
</regex>
<regex pattern="^([^ ]+) ([^ ]+) ([^ /]*)/([^ ]*)">
<data name="httpMethod" value="$1" />
<data name="url" value="$2" />
<data name="protocol" value="$3" />
<data name="version" value="$4" />
</regex>
</group>
</data>
<data name="responseB" value="$8" />
<data name="response" value="$9" />
<data name="timeM" value="$10" />
<data name="bytesIn" value="$11" />
<data name="bytesOut" value="$12" />
<data name="bytesOutContent" value="$13" />
<data name="referer" value="$14" />
<data name="userAgent" value="$15" />
<data name="vserver" value="$16" />
<data name="vserverport" value="$17" />
</regex>
</group>
</split>
</dataSplitter>
If we now press the Step First
 icon we will see the complete parsed record
If we click on the Step Forward
 icon we will see the next event displayed in both the input and output panes.
we click on the Step Last
 icon we will see the last event displayed in both the input and output panes.
You should take note of the stepping key that has been displayed in each stepping window. The stepping key are the numbers enclosed in square brackets e.g. [7556:1:16] found in the top right-hand side of the stepping window next to the stepping icons
The form of these keys is [ streamId ‘:’ subStreamId ‘:’ recordNo]
where
- streamId - is the stream ID and won’t change when stepping through the selected stream.
- subStreamId - is the sub stream ID. When Stroom processes event streams it aggregates multiple input files and this is the file number.
- recordNo - is the record number within the sub stream.
One can double click on either the subStreamId or recordNo numbers and enter a new number. This allows you to ‘step’ around a stream rather than just relying on first, previous, next and last movement.
Note, you should now Save
 your edited Text Converter.
Step data through Pipeline - Translation
To start authoring the xslt Translation Filter, press the
 translationFilter
element which steps us to the xsl Translation Filter pane.
As for the Text Converter stepping tab, this tab is divided into three sub-panes. The top one is the xslt translation editor and it will allow you to edit the xslt translation. The bottom left window displays the input to the xslt translation (which is the output from the Text Converter). The bottom right window displays the output from the xslt Translation filter for the given input.
We now click on the pipeline Step Forward button
 to single step the Text Converter records element data through our xslt Translation. We see no change as an empty translation will just perform a copy of the input data.
To correct this, we will author our xslt translation. Like the Data Splitter this is also authored incrementally. A minimum xslt translation might contain
<?xml version="1.0" encoding="UTF-8" ?>
<xsl:stylesheet
    xpath-default-namespace="records:2"
    xmlns="event-logging:3"
    xmlns:stroom="stroom"
    xmlns:xsl="http://www.w3.org/1999/XSL/Transform"
    xmlns:xsi="http://www.w3.org/2001/XMLSchema-instance"
    xmlns:xs="http://www.w3.org/2001/XMLSchema"
    version="3.0">

  <!-- Ingest the records tree -->
  <xsl:template match="records">
    <Events xsi:schemaLocation="event-logging:3 file://event-logging-v3.2.3.xsd" Version="3.2.3">
        <xsl:apply-templates />
    </Events>
  </xsl:template>

    <!-- Only generate events if we have an url on input -->
    <xsl:template match="record[data[@name = 'url']]">
        <Event>
            <xsl:apply-templates select="." mode="eventTime" />
            <xsl:apply-templates select="." mode="eventSource" />
            <xsl:apply-templates select="." mode="eventDetail" />
        </Event>
    </xsl:template>

    <xsl:template match="node()"  mode="eventTime">
        <EventTime>
            <TimeCreated/>
        </EventTime>
    </xsl:template>

    <xsl:template match="node()"  mode="eventSource">
        <EventSource>
            <System>
                <Name  />
                <Environment />
            </System>
            <Generator />
            <Device />
            <Client />
            <Server />
            <User>
                <Id />
            </User>
        </EventSource>
    </xsl:template>

    <xsl:template match="node()"  mode="eventDetail">
        <EventDetail>
            <TypeId>SendToWebService</TypeId>
            <Description />
            <Classification />
            <Send />
        </EventDetail>
    </xsl:template>
</xsl:stylesheet>
Clearly this doesn’t generate useful events. Our first iterative change might be to generate the TimeCreated element value. The change would be
<xsl:template match="node()" mode="eventTime">
<EventTime>
<TimeCreated>
<xsl:value-of select="stroom:format-date(data[@name = 'time']/@value, 'dd/MMM/yyyy:HH:mm:ss XX')" />
</TimeCreated>
</EventTime>
</xsl:template>
Adding in the EventSource elements (without ANY error checking!) as per
<xsl:template match="node()" mode="eventSource">
<EventSource>
<System>
<Name>
<xsl:value-of select="stroom:feed-attribute('System')" />
</Name>
<Environment>
<xsl:value-of select="stroom:feed-attribute('Environment')" />
</Environment>
</System>
<Generator>Apache HTTPD</Generator>
<Device>
<HostName>
<xsl:value-of select="stroom:feed-attribute('MyHost')" />
</HostName>
<IPAddress>
<xsl:value-of select="stroom:feed-attribute('MyIPAddress')" />
</IPAddress>
</Device>
<Client>
<IPAddress>
<xsl:value-of select="data[@name = 'clientip']/@value" />
</IPAddress>
<Port>
<xsl:value-of select="data[@name = 'clientport']/@value" />
</Port>
</Client>
<Server>
<HostName>
<xsl:value-of select="data[@name = 'vserver']/@value" />
</HostName>
<Port>
<xsl:value-of select="data[@name = 'vserverport']/@value" />
</Port>
</Server>
<User>
<Id>
<xsl:value-of select="data[@name='user']/@value" />
</Id>
</User>
</EventSource>
</xsl:template>
And after a Refresh Current Step
 we see our output event ‘grow’ to
We now complete our translation by expanding the EventDetail elements to have the completed translation of (again with limited error checking and non-existent documentation!)
<?xml version="1.0" encoding="UTF-8" ?>
<xsl:stylesheet
xpath-default-namespace="records:2"
xmlns="event-logging:3"
xmlns:stroom="stroom"
xmlns:xsl="http://www.w3.org/1999/XSL/Transform"
xmlns:xsi="http://www.w3.org/2001/XMLSchema-instance"
xmlns:xs="http://www.w3.org/2001/XMLSchema"
version="3.0">
<!-- Ingest the records tree -->
<xsl:template match="records">
<Events xsi:schemaLocation="event-logging:3 file://event-logging-v3.2.3.xsd" Version="3.2.3">
<xsl:apply-templates />
</Events>
</xsl:template>
<!-- Only generate events if we have an url on input -->
<xsl:template match="record[data[@name = 'url']]">
<Event>
<xsl:apply-templates select="." mode="eventTime" />
<xsl:apply-templates select="." mode="eventSource" />
<xsl:apply-templates select="." mode="eventDetail" />
</Event>
</xsl:template>
<xsl:template match="node()" mode="eventTime">
<EventTime>
<TimeCreated>
<xsl:value-of select="stroom:format-date(data[@name = 'time']/@value, 'dd/MMM/yyyy:HH:mm:ss XX')" />
</TimeCreated>
</EventTime>
</xsl:template>
<xsl:template match="node()" mode="eventSource">
<EventSource>
<System>
<Name>
<xsl:value-of select="stroom:feed-attribute('System')" />
</Name>
<Environment>
<xsl:value-of select="stroom:feed-attribute('Environment')" />
</Environment>
</System>
<Generator>Apache HTTPD</Generator>
<Device>
<HostName>
<xsl:value-of select="stroom:feed-attribute('MyHost')" />
</HostName>
<IPAddress>
<xsl:value-of select="stroom:feed-attribute('MyIPAddress')" />
</IPAddress>
</Device>
<Client>
<IPAddress>
<xsl:value-of select="data[@name = 'clientip']/@value" />
</IPAddress>
<Port>
<xsl:value-of select="data[@name = 'clientport']/@value" />
</Port>
</Client>
<Server>
<HostName>
<xsl:value-of select="data[@name = 'vserver']/@value" />
</HostName>
<Port>
<xsl:value-of select="data[@name = 'vserverport']/@value" />
</Port>
</Server>
<User>
<Id>
<xsl:value-of select="data[@name='user']/@value" />
</Id>
</User>
</EventSource>
</xsl:template>
<!-- -->
<xsl:template match="node()" mode="eventDetail">
<EventDetail>
<TypeId>SendToWebService</TypeId>
<Description>Send/Access data to Web Service</Description>
<Classification>
<Text>UNCLASSIFIED</Text>
</Classification>
<Send>
<Source>
<Device>
<IPAddress>
<xsl:value-of select="data[@name = 'clientip']/@value"/>
</IPAddress>
<Port>
<xsl:value-of select="data[@name = 'vserverport']/@value"/>
</Port>
</Device>
</Source>
<Destination>
<Device>
<HostName>
<xsl:value-of select="data[@name = 'vserver']/@value"/>
</HostName>
<Port>
<xsl:value-of select="data[@name = 'vserverport']/@value"/>
</Port>
</Device>
</Destination>
<Payload>
<Resource>
<URL>
<xsl:value-of select="data[@name = 'url']/@value"/>
</URL>
<Referrer>
<xsl:value-of select="data[@name = 'referer']/@value"/>
</Referrer>
<HTTPMethod>
<xsl:value-of select="data[@name = 'url']/data[@name = 'httpMethod']/@value"/>
</HTTPMethod>
<HTTPVersion>
<xsl:value-of select="data[@name = 'url']/data[@name = 'version']/@value"/>
</HTTPVersion>
<UserAgent>
<xsl:value-of select="data[@name = 'userAgent']/@value"/>
</UserAgent>
<InboundSize>
<xsl:value-of select="data[@name = 'bytesIn']/@value"/>
</InboundSize>
<OutboundSize>
<xsl:value-of select="data[@name = 'bytesOut']/@value"/>
</OutboundSize>
<OutboundContentSize>
<xsl:value-of select="data[@name = 'bytesOutContent']/@value"/>
</OutboundContentSize>
<RequestTime>
<xsl:value-of select="data[@name = 'timeM']/@value"/>
</RequestTime>
<ConnectionStatus>
<xsl:value-of select="data[@name = 'constatus']/@value"/>
</ConnectionStatus>
<InitialResponseCode>
<xsl:value-of select="data[@name = 'responseB']/@value"/>
</InitialResponseCode>
<ResponseCode>
<xsl:value-of select="data[@name = 'response']/@value"/>
</ResponseCode>
<Data Name="Protocol">
<xsl:attribute select="data[@name = 'url']/data[@name = 'protocol']/@value" name="Value"/>
</Data>
</Resource>
</Payload>
<!-- Normally our translation at this point would contain an <Outcome> attribute.
Since all our sample data includes only successful outcomes we have ommitted the <Outcome> attribute
in the translation to minimise complexity-->
</Send>
</EventDetail>
</xsl:template>
</xsl:stylesheet>
And after a Refresh Current Step
 we see the completed
 <EventDetail> section of our output event
Note, you should now Save
 your edited xslt Translation.
We have completed the translation and have completed developing our Apache-SSLBlackBox-V2.0-EVENTS event feed.
At this point, this event feed is set up to accept Raw Event data, but it will not automatically process the raw data and hence it will not place events into the Event Store. To have Stroom automatically process Raw Event streams, you will need to enable Processors for this pipeline.
5.3 - Event Processing
This HOWTO is provided to assist users in setting up Stroom to process inbound raw event logs and transform them into the Stroom Event Logging XML Schema.
Introduction
This HOWTO is provided to assist users in setting up Stroom to process inbound raw event logs and transform them into the Stroom Event Logging XML Schema.
This HOWTO will demonstrate the process by which an Event Processing pipeline for a given Event Source is developed and deployed.
The sample event source used will be based on BlueCoat Proxy logs.
An extract of BlueCoat logs were sourced from
log-sharing.dreamhosters.com
(a Public Security Log Sharing Site) but modified to add sample user attribution.
Template pipelines are being used to simplify the establishment of this processing pipeline.
The sample BlueCoat Proxy log will be transformed into an intermediate simple XML key value pair structure, then into the
Stroom Event Logging XML Schema
format.
Assumptions
The following assumptions are used in this document.
- The user successfully deployed Stroom
- The following Stroom content packages have been installed:
- Template Pipelines
- XML Schemas
Event Source
As mentioned, we will use BlueCoat Proxy logs as a sample event source.
Although BlueCoat logs can be customised, the default is to use the W2C Extended Log File Format (ELF).
Our sample data set looks like
#Software: SGOS 3.2.4.28
#Version: 1.0
#Date: 2005-04-27 20:57:09
#Fields: date time time-taken c-ip sc-status s-action sc-bytes cs-bytes cs-method cs-uri-scheme cs-host cs-uri-path cs-uri-query cs-username s-hierarchy s-supplier-name rs(Content-Type) cs(User-Agent) sc-filter-result sc-filter-category x-virus-id s-ip s-sitename x-virus-details x-icap-error-code x-icap-error-details
2005-05-04 17:16:12 1 45.110.2.82 200 TCP_HIT 941 729 GET http www.inmobus.com /wcm/assets/images/imagefileicon.gif - george DIRECT 38.112.92.20 image/gif "Mozilla/4.0 (compatible; MSIE 6.0; Windows NT 5.1; SV1; .NET CLR 1.1.4322)" PROXIED none - 192.16.170.42 SG-HTTP-Service - none -
2005-05-04 17:16:12 2 45.110.2.82 200 TCP_HIT 941 729 GET http www.inmobus.com /wcm/assets/images/imagefileicon.gif - george DIRECT 38.112.92.20 image/gif "Mozilla/4.0 (compatible; MSIE 6.0; Windows NT 5.1; SV1; .NET CLR 1.1.4322)" PROXIED none - 192.16.170.42 SG-HTTP-Service - none -
2005-05-04 17:16:12 2 45.110.2.82 200 TCP_HIT 941 729 GET http www.inmobus.com /wcm/assets/images/imagefileicon.gif - george DIRECT 38.112.92.20 image/gif "Mozilla/4.0 (compatible; MSIE 6.0; Windows NT 5.1; SV1; .NET CLR 1.1.4322)" PROXIED none - 192.16.170.42 SG-HTTP-Service - none -
2005-05-04 17:16:12 1 45.110.2.82 200 TCP_HIT 941 729 GET http www.inmobus.com /wcm/assets/images/imagefileicon.gif - george DIRECT 38.112.92.20 image/gif "Mozilla/4.0 (compatible; MSIE 6.0; Windows NT 5.1; SV1; .NET CLR 1.1.4322)" PROXIED none - 192.16.170.42 SG-HTTP-Service - none -
2005-05-04 17:16:12 1 45.110.2.82 200 TCP_HIT 941 729 GET http www.inmobus.com /wcm/assets/images/imagefileicon.gif - george DIRECT 38.112.92.20 image/gif "Mozilla/4.0 (compatible; MSIE 6.0; Windows NT 5.1; SV1; .NET CLR 1.1.4322)" PROXIED none - 192.16.170.42 SG-HTTP-Service - none -
2005-05-04 17:16:12 1 45.110.2.82 200 TCP_HIT 941 729 GET http www.inmobus.com /wcm/assets/images/imagefileicon.gif - george DIRECT 38.112.92.20 image/gif "Mozilla/4.0 (compatible; MSIE 6.0; Windows NT 5.1; SV1; .NET CLR 1.1.4322)" PROXIED none - 192.16.170.42 SG-HTTP-Service - none -
2005-05-04 17:16:12 51 45.14.4.127 200 TCP_NC_MISS 926 1104 GET http images.google.com /imgres ?imgurl=http://www.bettercomponents.be/images/linux-logo.gif&imgrefurl=http://www.bettercomponents.be/index.php%253FcPath%253D96&h=360&w=327&sz=132&tbnid=UKfPlBMXgToJ:&tbnh=117&tbnw=106&hl=en&prev=/images%253Fq%253Dlinux%252Blogo%2526hl%253Den%2526lr%253D&frame=small sally DIRECT images.google.com text/html "Mozilla/5.0 (Macintosh; U; PPC Mac OS X; en) AppleWebKit/312.1 (KHTML, like Gecko) Safari/312" PROXIED Hacking/Proxy%20Avoidance - 192.16.170.42 SG-HTTP-Service - none -
2005-05-04 17:16:12 2 45.110.2.82 200 TCP_HIT 941 729 GET http www.inmobus.com /wcm/assets/images/imagefileicon.gif - george DIRECT 38.112.92.20 image/gif "Mozilla/4.0 (compatible; MSIE 6.0; Windows NT 5.1; SV1; .NET CLR 1.1.4322)" PROXIED none - 192.16.170.42 SG-HTTP-Service - none -
2005-05-04 17:16:12 1 45.110.2.82 200 TCP_HIT 941 729 GET http www.inmobus.com /wcm/assets/images/imagefileicon.gif - george DIRECT 38.112.92.20 image/gif "Mozilla/4.0 (compatible; MSIE 6.0; Windows NT 5.1; SV1; .NET CLR 1.1.4322)" PROXIED none - 192.16.170.42 SG-HTTP-Service - none -
2005-05-04 17:16:12 1 45.110.2.82 200 TCP_HIT 941 729 GET http www.inmobus.com /wcm/assets/images/imagefileicon.gif - george DIRECT 38.112.92.20 image/gif "Mozilla/4.0 (compatible; MSIE 6.0; Windows NT 5.1; SV1; .NET CLR 1.1.4322)" PROXIED none - 192.16.170.42 SG-HTTP-Service - none -
2005-05-04 17:16:12 1 45.110.2.82 200 TCP_HIT 941 729 GET http www.inmobus.com /wcm/assets/images/imagefileicon.gif - george DIRECT 38.112.92.20 image/gif "Mozilla/4.0 (compatible; MSIE 6.0; Windows NT 5.1; SV1; .NET CLR 1.1.4322)" PROXIED none - 192.16.170.42 SG-HTTP-Service - none -
2005-05-04 17:16:12 1 45.110.2.82 200 TCP_HIT 941 729 GET http www.inmobus.com /wcm/assets/images/imagefileicon.gif - george DIRECT 38.112.92.20 image/gif "Mozilla/4.0 (compatible; MSIE 6.0; Windows NT 5.1; SV1; .NET CLR 1.1.4322)" PROXIED none - 192.16.170.42 SG-HTTP-Service - none -
2005-05-04 17:16:12 98 45.14.3.52 200 TCP_HIT 14258 321 GET http www.cedardalechurch.ca /birdscp2.gif - brad DIRECT 209.135.103.13 image/gif "Mozilla/4.0 (compatible; MSIE 6.0; Windows NT 5.1)" PROXIED none - 192.16.170.42 SG-HTTP-Service - none -
2005-05-04 17:16:12 1 45.110.2.82 200 TCP_HIT 941 729 GET http www.inmobus.com /wcm/assets/images/imagefileicon.gif - george DIRECT 38.112.92.20 image/gif "Mozilla/4.0 (compatible; MSIE 6.0; Windows NT 5.1; SV1; .NET CLR 1.1.4322)" PROXIED none - 192.16.170.42 SG-HTTP-Service - none -
2005-05-04 17:16:12 2 45.110.2.82 200 TCP_HIT 941 729 GET http www.inmobus.com /wcm/assets/images/imagefileicon.gif - george DIRECT 38.112.92.20 image/gif "Mozilla/4.0 (compatible; MSIE 6.0; Windows NT 5.1; SV1; .NET CLR 1.1.4322)" PROXIED none - 192.16.170.42 SG-HTTP-Service - none -
2005-05-04 17:16:12 2717 45.110.2.82 200 TCP_NC_MISS 3926 1051 GET http www.inmobus.com /wcm/isocket/iSocket.cfm ?requestURL=http://www.inmobus.com/wcm/html/../isocket/image_manager_search.cfm?dsn=InmobusWCM&projectid=26&SetModule=WCM&iSocketAction=response&responseContainer=leftTopDiv george DIRECT www.inmobus.com text/html;%20charset=UTF-8 "Mozilla/4.0 (compatible; MSIE 6.0; Windows NT 5.1; SV1; .NET CLR 1.1.4322)" PROXIED none - 192.16.170.42 SG-HTTP-Service - none -
2005-05-04 17:16:12 1 45.110.2.82 200 TCP_HIT 941 729 GET http www.inmobus.com /wcm/assets/images/imagefileicon.gif - george DIRECT 38.112.92.20 image/gif "Mozilla/4.0 (compatible; MSIE 6.0; Windows NT 5.1; SV1; .NET CLR 1.1.4322)" PROXIED none - 192.16.170.42 SG-HTTP-Service - none -
2005-05-04 17:16:12 1 45.110.2.82 200 TCP_HIT 941 729 GET http www.inmobus.com /wcm/assets/images/imagefileicon.gif - george DIRECT 38.112.92.20 image/gif "Mozilla/4.0 (compatible; MSIE 6.0; Windows NT 5.1; SV1; .NET CLR 1.1.4322)" PROXIED none - 192.16.170.42 SG-HTTP-Service - none -
2005-05-04 17:16:12 47 45.14.4.127 200 TCP_NC_MISS 2620 926 GET http images.google.com /images ?q=tbn:UKfPlBMXgToJ:http://www.bettercomponents.be/images/linux-logo.gif jane DIRECT images.google.com image/jpeg "Mozilla/5.0 (Macintosh; U; PPC Mac OS X; en) AppleWebKit/312.1 (KHTML, like Gecko) Safari/312" PROXIED Hacking/Proxy%20Avoidance - 192.16.170.42 SG-HTTP-Service - none -
2005-05-04 17:16:12 1 45.110.2.82 200 TCP_HIT 941 729 GET http www.inmobus.com /wcm/assets/images/imagefileicon.gif - george DIRECT 38.112.92.20 image/gif "Mozilla/4.0 (compatible; MSIE 6.0; Windows NT 5.1; SV1; .NET CLR 1.1.4322)" PROXIED none - 192.16.170.42 SG-HTTP-Service - none -
2005-05-04 17:16:13 139 45.112.2.73 207 TCP_NC_MISS 819 418 PROPFIND http idisk.mac.com /patrickarnold/Public/Show - bill DIRECT idisk.mac.com text/xml;charset=utf-8 "WebDAVFS/1.2.7 (01278000) Darwin/7.8.0 (Power Macintosh)" PROXIED Computers/Internet - 192.16.170.42 SG-HTTP-Service - none -
2005-05-04 17:16:13 2 45.106.2.66 200 TCP_HIT 559 348 GET http aim-charts.pf.aol.com / ?action=aim&fields=snpghlocvAa&syms=INDEX:COMPX,INDEX:INDU,INDEX:INX,TWX sally DIRECT 205.188.136.217 text/plain "AIM/30 (Mozilla 1.24b; Windows; I; 32-bit)" PROXIED Web%20Communications - 192.16.170.42 SG-HTTP-Service - none -
2005-05-04 17:16:13 9638 45.106.3.71 200 TCP_NC_MISS 46052 1921 POST http home.silverstar.com /cgi-bin/mailman.cgi - carol DIRECT home.silverstar.com text/html "Mozilla/5.0 (Windows; U; Windows NT 5.1; en-US; rv:1.7.6) Gecko/20050317 Firefox/1.0.2" PROXIED Computers/Internet - 192.16.170.42 SG-HTTP-Service - none -
2005-05-04 17:16:13 173 45.112.2.73 207 TCP_NC_MISS 647 436 PROPFIND http idisk.mac.com /patrickarnold/Public/Show/nuvio_05_what.swf - bill DIRECT idisk.mac.com text/xml;charset=utf-8 "WebDAVFS/1.2.7 (01278000) Darwin/7.8.0 (Power Macintosh)" PROXIED Computers/Internet - 192.16.170.42 SG-HTTP-Service - none -
2005-05-04 17:17:26 495 45.108.2.100 401 TCP_NC_MISS 1007 99884 PUT http idisk.mac.com /fayray_account_transfer_holding_area_for_pictures_to_homepage_temporary/Documents/85bT9bmviawEbbBb4Sie/Image-2743371ABCC011D9.jpg - - DIRECT idisk.mac.com text/html;charset=iso-8859-1 "DotMacKit/1.1 (10.4.0; iPho)" PROXIED Computers/Internet - 192.16.170.42 SG-HTTP-Service - none -
Later in this HOWTO, one will be required to upload this file.
If you save this file now, ensure the file is saved
as a text document with ANSI encoding.
Establish the Processing Pipeline
We will create the components that make up the processing pipeline for transforming these raw logs into the Stroom Event Logging XML Schema.
They will be placed a folder appropriately named BlueCoat in the path System/Event Sources/Proxy.
See Folder Creation for details on creating such a folder.
There will be four components
- the Event Feed to group the BlueCoat log files
- the Text Converter to convert the BlueCoat raw logs files into simple XML
- the XSLT Translation to translate the simple XML formed by the Text Converter into the Stroom Event Logging XML form, and
- the Processing pipeline which manages how the processing is performed.
All components will have the same Name BlueCoat-Proxy-V1.0-EVENTS.
It should be noted that the default Stroom FeedName pattern will not accept this name.
One needs to modify the stroom.feedNamePattern stroom property to change the default pattern to ^[a-zA-Z0-9_-\.]{3,}$.
See the HOWTO on System Properties docment to see how to make this change.
Create the Event Feed
We first select (with a left click) the System/Event Sources/Proxy/BlueCoat folder in the Explorer tab then right click and select:
 New =>
 Feed
Feed
This will open the New Feed configuration window into which we enter BlueCoat-Proxy-V1.0-EVENTS into the Name: entry box
and press
Ok
to see the new Event Feed tab
and it’s corresponding reference in the Explorer display.
The configuration items for a Event Feed are
- Description - a description of the feed
- Classification - the classification or sensitivity of the Event Feed data
- Reference Feed Flag - to indicate if this is a
Reference Feed or not
- Feed Status - which indicates if we accept data, reject it or silently drop it
- Stream Type - to indicate if the
Feed contains raw log data or reference data
- Data Encoding - the character encoding of the data being sent to the
Feed
- Context Encoding - the character encoding of context data associated with this
Feed
- Retention Period - the amount of time to retain the Event data
In our example, we will set the above to
- Description - BlueCoat Proxy log data sent in W2C Extended Log File Format (ELFF)
- Classification - We will leave this blank
- Reference Feed Flag - We leave the check-box unchecked as this is not a Reference Feed
- Feed Status - We set to Receive
- Stream Type - We set to Raw Events as we will be sending batches (streams) of raw event logs
- Data Encoding - We leave at the default of UTF-8 as this is the proposed character encoding
- Context Encoding - We leave at the default of UTF-8 as there are no Context Events for this Feed
- Retention Period - We leave at Forever was we do not want to delete any collected BlueCoat event data.
One should note that the Feed tab
 * BlueCoat-Proxy-V1.0-EVENTS
×
has been marked as having unsaved changes.
This is indicated by the asterisk character
 * between the Feed icon
 and the name of the feed BlueCoat-Proxy-V1.0-EVENTS.
We can save the changes to our feed by pressing the Save icon
 in the top left of the BlueCoat-Proxy-V1.0-EVENTS tab.
At this point one should notice two things, the first is that the asterisk
has disappeared from the
 Feed tab and the the second is that the Save icon
 is now disabled.
Create the Text Converter
We now create the Text Converter for this Feed in a similar fashion to the Event Feed.
We first select (with a left click) the System/Event Sources/Proxy/BlueCoat folder in the Explorer tab then right click and select
 New =>
 Text Converter
Enter BlueCoat-Proxy-V1.0-EVENTS into the Name: entry box and press the
Ok
which results in the creation of the Text Converter tab
and it’s corresponding reference in the Explorer display.
We set the configuration for this Text Converter to be
- Description - Simple XML transform for BlueCoat Proxy log data sent in W2C Extended Log File Format (ELFF)
- Converter Type - We set to Data Splitter was we will be using the Stroom Data Splitter facility to convert the raw log data into simple XML.
Again, press the Save icon
 to save the configuration items.
Create the XSLT Translation
We now create the XSLT translation for this Feed in a similar fashion to the Event Feed or Text Converter.
We first select (with a left click) the System/Event Sources/Proxy/BlueCoat folder in the Explorer tab then right click and select:
 New =>
 XSLT
XSLT
Enter BlueCoat-Proxy-V1.0-EVENTS into the Name: entry box and press the
Ok
which results in the creation of the XSLT Translation tab
and it’s corresponding reference in the Explorer display.
We set the configuration for this XSLT Translation to be
- Description - Transform simple XML of BlueCoat Proxy log data into Stroom Event Logging XML form
Again, press the Save icon
 to save the configuration items.
Create the Pipeline
We now create the Pipeline for this Feed in a similar fashion to the Event Feed, Text Converter or XSLT Translation.
We first select (with a left click) the System/Event Sources/Proxy/BlueCoat folder in the Explorer tab then right click and select:
 New =>
 Pipeline
Enter BlueCoat-Proxy-V1.0-EVENTS into the Name: entry box and press the
Ok
which results in the creation of the Pipeline tab
and it’s corresponding reference in the Explorer display.
We set the configuration for this Pipeline to be
- Description - Processing of XML of BlueCoat Proxy log data into Stroom Event Logging XML
- Type - We leave as Event Data as this is an Event Data pipeline
We now need to configure the Structure of this Pipeline.
We do this by selecting the Structure hyper-link of the *BlueCoat-Proxy-V1.0-EVENTS Pipeline tab.
At this we see the Pipeline Structure configuration tab
As noted in the Assumptions at the start, we have loaded the Template Pipeline content pack, so that we can Inherit a pipeline structure from this content pack and configure it to support this specific feed.
We find a template by selecting the Inherit From: None
 entry box to reveal a Choose Item configuration item window.
Select the Template Pipelines folder by pressing the
 icon to the left of the folder to reveal the choice of available templates.
For our BlueCoat feed we will select the Event Data (Text) template.
This is done by moving the cursor to the relevant line and select via a left click
then pressing
Ok
to see the inherited pipeline structure
For the purpose of this HOWTO, we are only interested in two of the eleven (11) elements in this pipeline
- the Text Converter labeled dsParser
- the XSLT Translation labeled translationFilter
We need to assign our BlueCoat-Proxy-V1.0-EVENTS Text Converter and XSLT Translation to these elements respectively.
Text Converter Configuration
We do this by first selecting (left click) the dsParser element at which we see the Property sub-window displayed
We then select (left click) the textConverter Property Name
then press the Edit Property button
 .
At this, the
 Edit Property configuration window is displayed.
We select the Value: None
 entry box labeled to reveal a Choose Item configuration item window.
We traverse the folder structure until we can select the BlueCoat-Proxy-V1.0-EVENTS Text Converter as per
and then press the
Ok
to see that the Property Value: has been selected.
and pressing the
Ok
button of the Edit Property configuration window results in the pipelines dsParser property being set.
XSLT Translation Configuration
We do this by first selecting (left click) the translationFilter element at which we see the Property sub-window displayed
We then select (left click) the xslt Property Name
and following the same steps as for the Text Converter property selection, we assign the BlueCoat-Proxy-V1.0-EVENTS XSLT Translation to the xslt property.
At this point, we save these changes by pressing the Save icon
 .
.
Authoring the Translation
We are now ready to author the translation.
Close all tabs except for the Welcome and BlueCoat-Proxy-V1.0-EVENTS Feed tabs.
On the BlueCoat-Proxy-V1.0-EVENTS Feed tab, select the Data hyper-link to be presented with the Data pane of our tab.
Although we can post our test data set to this feed, we will manually upload it via the Data pane.
To do this we press the Upload button
 in the top Data pane to display the
 Upload configuration window
In a Production situation, where we would post log files to Stroom, we would include certain HTTP Header variables that, as we shall see, will be used
as part of the translation.
These header variables typically provide situational awareness of the source system sending the events.
For our purposes we set the following HTTP Header variables
Environment:Development
LogFileName:sampleBluecoat.log
MyHost:"somenode.strmdev00.org"
MyIPaddress:"192.168.2.220 192.168.122.1"
MyMeta:"FQDN:somenode.strmdev00.org\nipaddress:192.168.2.220\nipaddress_eth0:192.168.2.220\nipaddress_lo:127.0.0.1\nipaddress_virbr0:192.168.122.1\n"
MyNameServer:"gateway.strmdev00.org."
MyTZ:+1000
Shar256:056f0d196ffb4bc6c5f3898962f1708886bb48e2f20a81fb93f561f4d16cb2aa
System:Site http://log-sharing.dreamhosters.com/ Bluecoat Logs
Version:V1.0
These are set by entering them into the Meta Data: entry box.
Having done this we select a Stream Type: of Raw Events
We leave the Effective: entry box empty as this stream of raw event logs does not have an Effective Date (only Reference Feeds set this).
And we choose our file sampleBluecoat.log, by clicking on the Browse button in the File: entry box, which brings up the brower’s standard file upload selection window.
Having selected our file, we see
On pressing
Ok
and Alert pop-up window is presented indicating the file was uploaded
Again press
Close
to show that the data has been uploaded as a Stream into the BlueCoat-Proxy-V1.0-EVENTS Event Feed.
The top pane holds a table of the latest streams that pertain to the feed.
We see the one item which is the stream we uploaded.
If we select it, we see that a stream summary is also displayed in the centre pane (which shows details of the specific selected feed and associated streams.
We also see that the bottom pane displays the data associated with the selected item.
In this case, the first lines of content from the BlueCoat sample log file.
If we were to select the Meta hyper-link of the lower pane, one would see the metadata Stroom records for this Stream of data.
You should see all the HTTP variables we set as part of the Upload step as well as some that Stroom has automatically set.
We now switch back to the Data hyper-link before we start to develop the actual translation.
Stepping the Pipeline
We will now author the two translation components of the pipeline, the data splitter that will transform our lines of BlueCoat data into a simple xml format and then the XSLT translation that will take this simple xml format and translate it into appropriate Stroom Event Logging XML form.
We start by ensuring our Raw Events Data stream is selected and we press the Enter Stepping Mode
 button on the lower right hand side of the bottom
 Stream Data pane.
You will be prompted to select a pipeline to step with.
Choose the BlueCoat-Proxy-V1.0-EVENTS pipeline
then press
Ok
.
Stepping the Pipeline - Source
You will be presented with the Source element of the pipeline that shows our selected stream’s raw data.
We see two panes here.
The top pane displays the Pipeline structure with Source selected (we could refer to this as the stepping pane) and it also displays a step indicator (three colon separated numbers enclosed in square brackets initially the numbers are dashes i.e. [-:-:-] as we have yet to step) and a set of green Stepping Actions.
The step indicator and Stepping Actions allows one the step through a log file, selecting data event by event (an event is typically a line, but some events can be multi-line).
The bottom pane displays the first page (up to 100 lines) of data along with a set of blue Data Selection Actions.
The Data Selection Actions are used to step through the source data 100 lines at a time.
When multiple source log files have been aggregated into a single stream, two Data Selection Actions control buttons will be offered.
The right hand one will allow a user to step though the source data as before, but the left hand set of control buttons allows one to step between files from the aggregated event log files.
Stepping the Pipeline - dsParser
We now select the dsParser pipeline element that results in the window below
This window is made up of four panes.
The top pane remains the same - a display of the pipeline structure and the step indicator and green Stepping Actions.
The next pane down is the editing pane for the Text Converter.
This pane is used to edit the text converter that converts our line based BlueCoat Proxy logs into a XML format.
We make use of the Stroom Data Splitter facility to perform this transformation.
See here for complete details on the data splitter.
The lower two panes are the input and output displays for the text converter.
The authoring of this data splitter translation is outside the scope of this HOWTO.
It is recommended that one reads up on the Data Splitter and review the various samples found in the Stroom Context packs published, or the Pull Requests of
github.com/gchq/stroom-content
.
For the purpose of this HOWTO, the Datasplitter appears below.
The author believes the comments should support the understanding of the transformation.
<?xml version="1.0" encoding="UTF-8"?>
<dataSplitter
bufferSize="5000000"
xmlns="data-splitter:3"
xmlns:xsi="http://www.w3.org/2001/XMLSchema-instance"
xsi:schemaLocation="data-splitter:3 file://data-splitter-v3.0.xsd"
version="3.0"
ignoreErrors="true">
<!--
This datasplitter gains the Software and and Proxy version strings along with the log field names from the comments section of the log file.
That is from the lines ...
#Software: SGOS 3.2.4.28
#Version: 1.0
#Date: 2005-04-27 20:57:09
#Fields: date time time-taken c-ip sc-status s-action sc-bytes cs-bytes cs-method ... x-icap-error-code x-icap-error-details
We use the Field values as the header for the subsequent log fields
-->
<!-- Match the software comment line and save it in _bc_software -->
<regex id="software" pattern="^#Software: (.+) ?\n*">
<data name="_bc_software" value="$1" />
</regex>
<!-- Match the version comment line and save it in _bc_version -->
<regex id="version" pattern="^#Version: (.+) ?\n*">
<data name="_bc_version" value="$1" />
</regex>
<!-- Match against a Fields: header comment and save all the field names in a headings -->
<regex id="heading" pattern="^#Fields: (.+) ?\n*">
<group value="$1">
<regex pattern="^(\S+) ?\n*">
<var id="headings" />
</regex>
</group>
</regex>
<!-- Skip all other comment lines -->
<regex pattern="^#.+\n*">
<var id="ignorea" />
</regex>
<!-- We now match all other lines, applying the headings captured at the start of the file to each field value -->
<regex id="body" pattern="^[^#].+\n*">
<group>
<regex pattern="^"([^"]*)" ?\n*">
<data name="$headings$1" value="$1" />
</regex>
<regex pattern="^([^ ]+) *\n*">
<data name="$headings$1" value="$1" />
</regex>
</group>
</regex>
<!-- -->
</dataSplitter>
BlueCoat dataspliter
(
Download BlueCoat.ds
)
It should be entered into the Text Converter’s editing pane as per
As mentioned earlier, to step the translation, one uses the green Stepping Actions.
The actions are
-
 - progress the transformation to the first line of the translation input
-
 - progress the transformation one step backward
-
 - progress the transformation one step forward
-
 - progress the transformation to the end of the translation input
-
 - refresh the transformation based on the current translation input
So, if one was to press the
 stepping action we would be presented with
We see that the input pane has the first line of input from our sample file and the output pane has an XML record structure where we have defined a data element with the name attribute of bc_software and it’s value attribute of SGOS 3.2.4.28.
The definition of the record structure can be found in the System/XML Schemas/records folder.
This is the result of the code in our editor
<!-- Match the software comment line and save it in _bc_software -->
<regex id="software" pattern="^#Software: (.+) ?\n*">
<data name="_bc_software" value="$1" />
</regex>
If one presses the
 stepping action again, we see that we have moved to the second line of the input file with the resultant output of a data element with the name attribute of bc_version and it’s value attribute of 1.0.
Stepping forward once more causes the translation to ignore the Date comment line, define a Data Splitter $headings variable from the Fields comment line and transform the first line of actual event data.
We see that a <record> element has been formed with multiple key value pair <data> elements where the name attribute is the key and the value attribute the value.
You will note that the keys have been taken from the Fields comment line which where placed in the $headings variable.
You should also take note that the stepping indicator has been incrementing the last number, so at this point it is displaying [1:1:3].
The general form of this indicator is
'[' streamId ':' subStreamId ':' recordNo ']'
where
- streamId - is the stream ID and won’t change when stepping through the selected stream,
- subStreamId - is the sub stream ID.
When Stroom aggregates multiple event sources for a feed, it aggregates multiple input files and this is, in effect, the file number.
- recordNo - is the record number within the sub stream.
One can double click on either the subStreamId or recordNo entry and enter a new value.
This allows you to jump around a stream rather than just relying on first, previous, next and last movements.
Hovering the mouse over the stepping indicator will change the cursor to a hand pointer.
Selecting (by a left click) the recordNo will allow you to edit it’s value (and the other values for that matter).
You will see the display change from
to
If we change the record number from 3 to 12 then either press Enter or press the
 action we see
and note that a new record has been processed in the input and output panes.
Further, if one steps back to the Source element of the pipeline to view the raw source file, we see that the highlighted current line is the 12th line of processed data.
It is the 10th actual bluecoat event, but remember the #Software, #Version lines are considered as processed data (2+10 = 12).
Also noted that the #Date and #Fields lines are not considered processed data, and hence do not contribute to the recordNo value.
If we select the dsParser pipeline element then press the
 action we see the
 recordNo jump to 31 which is the last processed line of our sample log file.
Stepping the Pipeline - translationFilter
We now select the translationFilter pipeline element that results in
As for the dsParser, this window is made up of four panes.
The top pane remains the same - a display of the pipeline structure and the step indicator and green Stepping Actions.
The next pane down is the editing pane for the Translation Filter.
This pane is used to edit an xslt translation that converts our simple key value pair <records> XML structure into another XML form.
The lower two panes are the input and output displays for the xslt translation.
You will note that the input and output displays are identical for a null xslt translation is effectively a direct copy.
In this HOWTO we will transform the <records> XML structure into the GCHQ Stroom Event Logging XML Schema form which is documented
here
.
The authoring of this xslt translation is outside the scope of this HOWTO, as is the use of the Stroom XML Schema.
It is recommended that one reads up on XSLT Conversion and the
Stroom Event Logging XML Schema
and review the various samples found in the Stroom Context packs published, or the Pull Requests of
https://github.com/gchq/stroom-content
.
We will build the translation in steps.
We enter an initial portion of our xslt transformation that just consumes the Software and Version key values and converts the date and time values (which are in UTC) into the EventTime/TimeCreated element.
This code segment is
<?xml version="1.0" encoding="UTF-8" ?>
<xsl:stylesheet
xpath-default-namespace="records:2"
xmlns="event-logging:3"
xmlns:stroom="stroom"
xmlns:xsl="http://www.w3.org/1999/XSL/Transform"
xmlns:xsi="http://www.w3.org/2001/XMLSchema-instance"
xmlns:xs="http://www.w3.org/2001/XMLSchema"
version="3.0">
<!-- Bluecoat Proxy logs in W2C Extended Log File Format (ELF) -->
<!-- Ingest the record key value pair elements -->
<xsl:template match="records">
<Events xsi:schemaLocation="event-logging:3 file://event-logging-v3.2.4.xsd" Version="3.2.4">
<xsl:apply-templates />
</Events>
</xsl:template>
<!-- Main record template for single event -->
<xsl:template match="record">
<xsl:choose>
<!-- Store the Software and Version information of the Bluecoat log file for use
in the Event Source elements which are processed later -->
<xsl:when test="data[@name='_bc_software']">
<xsl:value-of select="stroom:put('_bc_software', data[@name='_bc_software']/@value)" />
</xsl:when>
<xsl:when test="data[@name='_bc_version']">
<xsl:value-of select="stroom:put('_bc_version', data[@name='_bc_version']/@value)" />
</xsl:when>
<!-- Process the event logs -->
<xsl:otherwise>
<Event>
<xsl:call-template name="event_time" />
</Event>
</xsl:otherwise>
</xsl:choose>
</xsl:template>
<!-- Time -->
<xsl:template name="event_time">
<EventTime>
<TimeCreated>
<xsl:value-of select="concat(data[@name = 'date']/@value,'T',data[@name='time']/@value,'.000Z')" />
</TimeCreated>
</EventTime>
</xsl:template>
</xsl:stylesheet>
After entering this translation and pressing the
 action shows the display
Note that this is the 31st record, so if we were to jump to the first record using the
 action, we see that the input and output change appropriately.
You will note that there is no Event element in the output pane as the record template in our xslt translation above is only storing the input’s key value (_bc_software’s value).
Further note that the BlueCoat_Proxy-V1.0-EVENTS tab
 * BlueCoat_Proxy-V1.0-EVENTS
×
has a star in front of it and also the Save icon
 is highlighted.
This indicates that a component of the pipeline needs to be saved.
In this case, the XSLT translation.
By pressing the Save icon, you will save the XSLT translation as it currently stands and both the star will be removed from the tab
 BlueCoat_Proxy-V1.0-EVENTS
×
and the Save icon
 will no longer be highlighted.
We next extend out translation by authoring a event_source template to form an appropriate Stroom Event Logging EventSource element structure.
Thus our translation now is
<?xml version="1.0" encoding="UTF-8" ?>
<xsl:stylesheet
xpath-default-namespace="records:2"
xmlns="event-logging:3"
xmlns:stroom="stroom"
xmlns:xsl="http://www.w3.org/1999/XSL/Transform"
xmlns:xsi="http://www.w3.org/2001/XMLSchema-instance"
xmlns:xs="http://www.w3.org/2001/XMLSchema"
version="3.0">
<!-- Bluecoat Proxy logs in W2C Extended Log File Format (ELF) -->
<!-- Ingest the record key value pair elements -->
<xsl:template match="records">
<Events xsi:schemaLocation="event-logging:3 file://event-logging-v3.2.4.xsd" Version="3.2.4">
<xsl:apply-templates />
</Events>
</xsl:template>
<!-- Main record template for single event -->
<xsl:template match="record">
<xsl:choose>
<!-- Store the Software and Version information of the Bluecoat log file for use in
the Event Source elements which are processed later -->
<xsl:when test="data[@name='_bc_software']">
<xsl:value-of select="stroom:put('_bc_software', data[@name='_bc_software']/@value)" />
</xsl:when>
<xsl:when test="data[@name='_bc_version']">
<xsl:value-of select="stroom:put('_bc_version', data[@name='_bc_version']/@value)" />
</xsl:when>
<!-- Process the event logs -->
<xsl:otherwise>
<Event>
<xsl:call-template name="event_time" />
<xsl:call-template name="event_source" />
</Event>
</xsl:otherwise>
</xsl:choose>
</xsl:template>
<!-- Time -->
<xsl:template name="event_time">
<EventTime>
<TimeCreated>
<xsl:value-of select="concat(data[@name = 'date']/@value,'T',data[@name='time']/@value,'.000Z')" />
</TimeCreated>
</EventTime>
</xsl:template>
<!-- Template for event source-->
<xsl:template name="event_source">
<!--
We extract some situational awareness information that the posting script includes when posting the event data
-->
<xsl:variable name="_mymeta" select="translate(stroom:meta('MyMeta'),'"', '')" />
<!-- Form the EventSource node -->
<EventSource>
<System>
<Name>
<xsl:value-of select="stroom:meta('System')" />
</Name>
<Environment>
<xsl:value-of select="stroom:meta('Environment')" />
</Environment>
</System>
<Generator>
<xsl:variable name="gen">
<xsl:if test="stroom:get('_bc_software')">
<xsl:value-of select="concat(' Software: ', stroom:get('_bc_software'))" />
</xsl:if>
<xsl:if test="stroom:get('_bc_version')">
<xsl:value-of select="concat(' Version: ', stroom:get('_bc_version'))" />
</xsl:if>
</xsl:variable>
<xsl:value-of select="concat('Bluecoat', $gen)" />
</Generator>
<xsl:if test="data[@name='s-computername'] or data[@name='s-ip']">
<Device>
<xsl:if test="data[@name='s-computername']">
<Name>
<xsl:value-of select="data[@name='s-computername']/@value" />
</Name>
</xsl:if>
<xsl:if test="data[@name='s-ip']">
<IPAddress>
<xsl:value-of select=" data[@name='s-ip']/@value" />
</IPAddress>
</xsl:if>
<xsl:if test="data[@name='s-sitename']">
<Data Name="ServiceType" Value="{data[@name='s-sitename']/@value}" />
</xsl:if>
</Device>
</xsl:if>
<!-- -->
<Client>
<xsl:if test="data[@name='c-ip']/@value != '-'">
<IPAddress>
<xsl:value-of select="data[@name='c-ip']/@value" />
</IPAddress>
</xsl:if>
<!-- Remote Port Number -->
<xsl:if test="data[@name='c-port']/@value !='-'">
<Port>
<xsl:value-of select="data[@name='c-port']/@value" />
</Port>
</xsl:if>
</Client>
<!-- -->
<Server>
<HostName>
<xsl:value-of select="data[@name='cs-host']/@value" />
</HostName>
</Server>
<!-- -->
<xsl:variable name="user">
<xsl:value-of select="data[@name='cs-user']/@value" />
<xsl:value-of select="data[@name='cs-username']/@value" />
<xsl:value-of select="data[@name='cs-userdn']/@value" />
</xsl:variable>
<xsl:if test="$user !='-'">
<User>
<Id>
<xsl:value-of select="$user" />
</Id>
</User>
</xsl:if>
<Data Name="MyMeta">
<xsl:attribute name="Value" select="$_mymeta" />
</Data>
</EventSource>
</xsl:template>
</xsl:stylesheet>
Stepping to the 3 record (the first real data record in our sample log) will reveal that our output pane has gained an EventSource element.
Note also, that our Save icon
 is also highlighted, so we should at some point save the extensions to our translation.
The complete translation now follows.
<?xml version="1.0" encoding="UTF-8" ?>
<xsl:stylesheet
xpath-default-namespace="records:2"
xmlns="event-logging:3"
xmlns:stroom="stroom"
xmlns:xsl="http://www.w3.org/1999/XSL/Transform"
xmlns:xsi="http://www.w3.org/2001/XMLSchema-instance"
xmlns:xs="http://www.w3.org/2001/XMLSchema"
version="3.0">
<!-- Bluecoat Proxy logs in W2C Extended Log File Format (ELF) -->
<!-- Ingest the record key value pair elements -->
<xsl:template match="records">
<Events xsi:schemaLocation="event-logging:3 file://event-logging-v3.2.4.xsd" Version="3.2.4">
<xsl:apply-templates />
</Events>
</xsl:template>
<!-- Main record template for single event -->
<xsl:template match="record">
<xsl:choose>
<!-- Store the Software and Version information of the Bluecoat log file for use in the Event
Source elements which are processed later -->
<xsl:when test="data[@name='_bc_software']">
<xsl:value-of select="stroom:put('_bc_software', data[@name='_bc_software']/@value)" />
</xsl:when>
<xsl:when test="data[@name='_bc_version']">
<xsl:value-of select="stroom:put('_bc_version', data[@name='_bc_version']/@value)" />
</xsl:when>
<!-- Process the event logs -->
<xsl:otherwise>
<Event>
<xsl:call-template name="event_time" />
<xsl:call-template name="event_source" />
<xsl:call-template name="event_detail" />
</Event>
</xsl:otherwise>
</xsl:choose>
</xsl:template>
<!-- Time -->
<xsl:template name="event_time">
<EventTime>
<TimeCreated>
<xsl:value-of select="concat(data[@name = 'date']/@value,'T',data[@name='time']/@value,'.000Z')" />
</TimeCreated>
</EventTime>
</xsl:template>
<!-- Template for event source-->
<xsl:template name="event_source">
<!-- We extract some situational awareness information that the posting script includes when
posting the event data -->
<xsl:variable name="_mymeta" select="translate(stroom:meta('MyMeta'),'"', '')" />
<!-- Form the EventSource node -->
<EventSource>
<System>
<Name>
<xsl:value-of select="stroom:meta('System')" />
</Name>
<Environment>
<xsl:value-of select="stroom:meta('Environment')" />
</Environment>
</System>
<Generator>
<xsl:variable name="gen">
<xsl:if test="stroom:get('_bc_software')">
<xsl:value-of select="concat(' Software: ', stroom:get('_bc_software'))" />
</xsl:if>
<xsl:if test="stroom:get('_bc_version')">
<xsl:value-of select="concat(' Version: ', stroom:get('_bc_version'))" />
</xsl:if>
</xsl:variable>
<xsl:value-of select="concat('Bluecoat', $gen)" />
</Generator>
<xsl:if test="data[@name='s-computername'] or data[@name='s-ip']">
<Device>
<xsl:if test="data[@name='s-computername']">
<Name>
<xsl:value-of select="data[@name='s-computername']/@value" />
</Name>
</xsl:if>
<xsl:if test="data[@name='s-ip']">
<IPAddress>
<xsl:value-of select=" data[@name='s-ip']/@value" />
</IPAddress>
</xsl:if>
<xsl:if test="data[@name='s-sitename']">
<Data Name="ServiceType" Value="{data[@name='s-sitename']/@value}" />
</xsl:if>
</Device>
</xsl:if>
<!-- -->
<Client>
<xsl:if test="data[@name='c-ip']/@value != '-'">
<IPAddress>
<xsl:value-of select="data[@name='c-ip']/@value" />
</IPAddress>
</xsl:if>
<!-- Remote Port Number -->
<xsl:if test="data[@name='c-port']/@value !='-'">
<Port>
<xsl:value-of select="data[@name='c-port']/@value" />
</Port>
</xsl:if>
</Client>
<!-- -->
<Server>
<HostName>
<xsl:value-of select="data[@name='cs-host']/@value" />
</HostName>
</Server>
<!-- -->
<xsl:variable name="user">
<xsl:value-of select="data[@name='cs-user']/@value" />
<xsl:value-of select="data[@name='cs-username']/@value" />
<xsl:value-of select="data[@name='cs-userdn']/@value" />
</xsl:variable>
<xsl:if test="$user !='-'">
<User>
<Id>
<xsl:value-of select="$user" />
</Id>
</User>
</xsl:if>
<Data Name="MyMeta">
<xsl:attribute name="Value" select="$_mymeta" />
</Data>
</EventSource>
</xsl:template>
<!-- Event detail -->
<xsl:template name="event_detail">
<EventDetail>
<!--
We model Proxy events as either Receive or Send events depending on the method.
We make use of the Receive/Send sub-elements Source/Destination to map
the Client/Destination Proxy values and the Payload sub-element to map
the URL and other details of the activity. If we have a query, we model
it as a Criteria
-->
<TypeId>
<xsl:value-of select="concat('Bluecoat-', data[@name='cs-method']/@value, '-', data[@name='cs-uri-scheme']/@value)" />
<xsl:if test="data[@name='cs-uri-query']/@value != '-'">-Query</xsl:if>
</TypeId>
<xsl:choose>
<xsl:when test="matches(data[@name='cs-method']/@value, 'GET|OPTIONS|HEAD')">
<Description>Receipt of information from a Resource via Proxy</Description>
<Receive>
<xsl:call-template name="setupParticipants" />
<xsl:call-template name="setPayload" />
<xsl:call-template name="setOutcome" />
</Receive>
</xsl:when>
<xsl:otherwise>
<Description>Transmission of information to a Resource via Proxy</Description>
<Send>
<xsl:call-template name="setupParticipants" />
<xsl:call-template name="setPayload" />
<xsl:call-template name="setOutcome" />
</Send>
</xsl:otherwise>
</xsl:choose>
</EventDetail>
</xsl:template>
<!-- Establish the Source and Destination nodes -->
<xsl:template name="setupParticipants">
<Source>
<Device>
<xsl:if test="data[@name='c-ip']/@value != '-'">
<IPAddress>
<xsl:value-of select="data[@name='c-ip']/@value" />
</IPAddress>
</xsl:if>
<!-- Remote Port Number -->
<xsl:if test="data[@name='c-port']/@value !='-'">
<Port>
<xsl:value-of select="data[@name='c-port']/@value" />
</Port>
</xsl:if>
</Device>
</Source>
<Destination>
<Device>
<HostName>
<xsl:value-of select="data[@name='cs-host']/@value" />
</HostName>
</Device>
</Destination>
</xsl:template>
<!-- Define the Payload node -->
<xsl:template name="setPayload">
<Payload>
<xsl:if test="data[@name='cs-uri-query']/@value != '-'">
<Criteria>
<DataSources>
<DataSource>
<xsl:value-of select="concat(data[@name='cs-uri-scheme']/@value, '://', data[@name='cs-host']/@value)" />
<xsl:if test="data[@name='cs-uri-path']/@value != '/'">
<xsl:value-of select="data[@name='cs-uri-path']/@value" />
</xsl:if>
</DataSource>
</DataSources>
<Query>
<Raw>
<xsl:value-of select="data[@name='cs-uri-query']/@value" />
</Raw>
</Query>
</Criteria>
</xsl:if>
<Resource>
<!-- Check for auth groups the URL belongs to -->
<xsl:variable name="authgroups">
<xsl:value-of select="data[@name='cs-auth-group']/@value" />
<xsl:if test="exists(data[@name='cs-auth-group']) and exists(data[@name='cs-auth-groups'])">,</xsl:if>
<xsl:value-of select="data[@name='cs-auth-groups']/@value" />
</xsl:variable>
<xsl:choose>
<xsl:when test="contains($authgroups, ',')">
<Groups>
<xsl:for-each select="tokenize($authgroups, ',')">
<Group>
<Id>
<xsl:value-of select="." />
</Id>
</Group>
</xsl:for-each>
</Groups>
</xsl:when>
<xsl:when test="$authgroups != '-' and $authgroups != ''">
<Groups>
<Group>
<Id>
<xsl:value-of select="$authgroups" />
</Id>
</Group>
</Groups>
</xsl:when>
</xsl:choose>
<!-- Re-form the URL -->
<URL>
<xsl:value-of select="concat(data[@name='cs-uri-scheme']/@value, '://', data[@name='cs-host']/@value)" />
<xsl:if test="data[@name='cs-uri-path']/@value != '/'">
<xsl:value-of select="data[@name='cs-uri-path']/@value" />
</xsl:if>
</URL>
<HTTPMethod>
<xsl:value-of select="data[@name='cs-method']/@value" />
</HTTPMethod>
<xsl:if test="data[@name='cs(User-Agent)']/@value !='-'">
<UserAgent>
<xsl:value-of select="data[@name='cs(User-Agent)']/@value" />
</UserAgent>
</xsl:if>
<!-- Inbound activity -->
<xsl:if test="data[@name='sc-bytes']/@value !='-'">
<InboundSize>
<xsl:value-of select="data[@name='sc-bytes']/@value" />
</InboundSize>
</xsl:if>
<xsl:if test="data[@name='sc-bodylength']/@value !='-'">
<InboundContentSize>
<xsl:value-of select="data[@name='sc-bodylength']/@value" />
</InboundContentSize>
</xsl:if>
<!-- Outbound activity -->
<xsl:if test="data[@name='cs-bytes']/@value !='-'">
<OutboundSize>
<xsl:value-of select="data[@name='cs-bytes']/@value" />
</OutboundSize>
</xsl:if>
<xsl:if test="data[@name='cs-bodylength']/@value !='-'">
<OutboundContentSize>
<xsl:value-of select="data[@name='cs-bodylength']/@value" />
</OutboundContentSize>
</xsl:if>
<!-- Miscellaneous -->
<RequestTime>
<xsl:value-of select="data[@name='time-taken']/@value" />
</RequestTime>
<ResponseCode>
<xsl:value-of select="data[@name='sc-status']/@value" />
</ResponseCode>
<xsl:if test="data[@name='rs(Content-Type)']/@value != '-'">
<MimeType>
<xsl:value-of select="data[@name='rs(Content-Type)']/@value" />
</MimeType>
</xsl:if>
<xsl:if test="data[@name='cs-categories']/@value != 'none' or data[@name='sc-filter-category']/@value != 'none'">
<Category>
<xsl:value-of select="data[@name='cs-categories']/@value" />
<xsl:value-of select="data[@name='sc-filter-category']/@value" />
</Category>
</xsl:if>
<!-- Take up other items as data elements -->
<xsl:apply-templates select="data[@name='s-action']" />
<xsl:apply-templates select="data[@name='cs-uri-scheme']" />
<xsl:apply-templates select="data[@name='s-hierarchy']" />
<xsl:apply-templates select="data[@name='sc-filter-result']" />
<xsl:apply-templates select="data[@name='x-virus-id']" />
<xsl:apply-templates select="data[@name='x-virus-details']" />
<xsl:apply-templates select="data[@name='x-icap-error-code']" />
<xsl:apply-templates select="data[@name='x-icap-error-details']" />
</Resource>
</Payload>
</xsl:template>
<!-- Generic Data capture template so we capture all other Bluecoat objects not already consumed -->
<xsl:template match="data">
<xsl:if test="@value != '-'">
<Data Name="{@name}" Value="{@value}" />
</xsl:if>
</xsl:template>
<!--
Set up the Outcome node.
We only set an Outcome for an error state. The absence of an Outcome infers success
-->
<xsl:template name="setOutcome">
<xsl:choose>
<!-- Favour squid specific errors first -->
<xsl:when test="data[@name='sc-status']/@value > 500">
<Outcome>
<Success>false</Success>
<Description>
<xsl:call-template name="responseCodeDesc">
<xsl:with-param name="code" select="data[@name='sc-status']/@value" />
</xsl:call-template>
</Description>
</Outcome>
</xsl:when>
<!-- Now check for 'normal' errors -->
<xsl:when test="tCliStatus > 400">
<Outcome>
<Success>false</Success>
<Description>
<xsl:call-template name="responseCodeDesc">
<xsl:with-param name="code" select="data[@name='sc-status']/@value" />
</xsl:call-template>
</Description>
</Outcome>
</xsl:when>
</xsl:choose>
</xsl:template>
<!-- Response Code map to Descriptions -->
<xsl:template name="responseCodeDesc">
<xsl:param name="code" />
<xsl:choose>
<!-- Informational -->
<xsl:when test="$code = 100">Continue</xsl:when>
<xsl:when test="$code = 101">Switching Protocols</xsl:when>
<xsl:when test="$code = 102">Processing</xsl:when>
<!-- Successful Transaction -->
<xsl:when test="$code = 200">OK</xsl:when>
<xsl:when test="$code = 201">Created</xsl:when>
<xsl:when test="$code = 202">Accepted</xsl:when>
<xsl:when test="$code = 203">Non-Authoritative Information</xsl:when>
<xsl:when test="$code = 204">No Content</xsl:when>
<xsl:when test="$code = 205">Reset Content</xsl:when>
<xsl:when test="$code = 206">Partial Content</xsl:when>
<xsl:when test="$code = 207">Multi Status</xsl:when>
<!-- Redirection -->
<xsl:when test="$code = 300">Multiple Choices</xsl:when>
<xsl:when test="$code = 301">Moved Permanently</xsl:when>
<xsl:when test="$code = 302">Moved Temporarily</xsl:when>
<xsl:when test="$code = 303">See Other</xsl:when>
<xsl:when test="$code = 304">Not Modified</xsl:when>
<xsl:when test="$code = 305">Use Proxy</xsl:when>
<xsl:when test="$code = 307">Temporary Redirect</xsl:when>
<!-- Client Error -->
<xsl:when test="$code = 400">Bad Request</xsl:when>
<xsl:when test="$code = 401">Unauthorized</xsl:when>
<xsl:when test="$code = 402">Payment Required</xsl:when>
<xsl:when test="$code = 403">Forbidden</xsl:when>
<xsl:when test="$code = 404">Not Found</xsl:when>
<xsl:when test="$code = 405">Method Not Allowed</xsl:when>
<xsl:when test="$code = 406">Not Acceptable</xsl:when>
<xsl:when test="$code = 407">Proxy Authentication Required</xsl:when>
<xsl:when test="$code = 408">Request Timeout</xsl:when>
<xsl:when test="$code = 409">Conflict</xsl:when>
<xsl:when test="$code = 410">Gone</xsl:when>
<xsl:when test="$code = 411">Length Required</xsl:when>
<xsl:when test="$code = 412">Precondition Failed</xsl:when>
<xsl:when test="$code = 413">Request Entity Too Large</xsl:when>
<xsl:when test="$code = 414">Request URI Too Large</xsl:when>
<xsl:when test="$code = 415">Unsupported Media Type</xsl:when>
<xsl:when test="$code = 416">Request Range Not Satisfiable</xsl:when>
<xsl:when test="$code = 417">Expectation Failed</xsl:when>
<xsl:when test="$code = 422">Unprocessable Entity</xsl:when>
<xsl:when test="$code = 424">Locked/Failed Dependency</xsl:when>
<xsl:when test="$code = 433">Unprocessable Entity</xsl:when>
<!-- Server Error -->
<xsl:when test="$code = 500">Internal Server Error</xsl:when>
<xsl:when test="$code = 501">Not Implemented</xsl:when>
<xsl:when test="$code = 502">Bad Gateway</xsl:when>
<xsl:when test="$code = 503">Service Unavailable</xsl:when>
<xsl:when test="$code = 504">Gateway Timeout</xsl:when>
<xsl:when test="$code = 505">HTTP Version Not Supported</xsl:when>
<xsl:when test="$code = 507">Insufficient Storage</xsl:when>
<xsl:when test="$code = 600">Squid: header parsing error</xsl:when>
<xsl:when test="$code = 601">Squid: header size overflow detected while parsing/roundcube: software configuration error</xsl:when>
<xsl:when test="$code = 603">roundcube: invalid authorization</xsl:when>
<xsl:otherwise>
<xsl:value-of select="concat('Unknown Code:', $code)" />
</xsl:otherwise>
</xsl:choose>
</xsl:template>
</xsl:stylesheet>
BlueCoat XSLT Translation
(
Download BlueCoat.xslt
)
Refreshing the current event will show the output pane contains
<?xml version="1.1" encoding="UTF-8"?>
<Events
xmlns="event-logging:3"
xmlns:stroom="stroom"
xmlns:xsi="http://www.w3.org/2001/XMLSchema-instance"
xmlns:xs="http://www.w3.org/2001/XMLSchema"
xsi:schemaLocation="event-logging:3 file://event-logging-v3.2.4.xsd"
Version="3.2.4">
<Event>
<EventTime>
<TimeCreated>2005-05-04T17:16:12.000Z</TimeCreated>
</EventTime>
<EventSource>
<System>
<Name>Site http://log-sharing.dreamhosters.com/ Bluecoat Logs</Name>
<Environment>Development</Environment>
</System>
<Generator>Bluecoat Software: SGOS 3.2.4.28 Version: 1.0</Generator>
<Device>
<IPAddress>192.16.170.42</IPAddress>
<Data Name="ServiceType" Value="SG-HTTP-Service" />
</Device>
<Client>
<IPAddress>45.110.2.82</IPAddress>
</Client>
<Server>
<HostName>www.inmobus.com</HostName>
</Server>
<User>
<Id>george</Id>
</User>
<Data Name="MyMeta" Value="FQDN:somenode.strmdev00.org\nipaddress:192.168.2.220\nipaddress_eth0:192.168.2.220\nipaddress_lo:127.0.0.1\nipaddress_virbr0:192.168.122.1\n" />
</EventSource>
<EventDetail>
<TypeId>Bluecoat-GET-http</TypeId>
<Description>Receipt of information from a Resource via Proxy</Description>
<Receive>
<Source>
<Device>
<IPAddress>45.110.2.82</IPAddress>
</Device>
</Source>
<Destination>
<Device>
<HostName>www.inmobus.com</HostName>
</Device>
</Destination>
<Payload>
<Resource>
<URL>http://www.inmobus.com/wcm/assets/images/imagefileicon.gif</URL>
<HTTPMethod>GET</HTTPMethod>
<UserAgent>Mozilla/4.0 (compatible; MSIE 6.0; Windows NT 5.1; SV1; .NET CLR 1.1.4322)</UserAgent>
<InboundSize>941</InboundSize>
<OutboundSize>729</OutboundSize>
<RequestTime>1</RequestTime>
<ResponseCode>200</ResponseCode>
<MimeType>image/gif</MimeType>
<Data Name="s-action" Value="TCP_HIT" />
<Data Name="cs-uri-scheme" Value="http" />
<Data Name="s-hierarchy" Value="DIRECT" />
<Data Name="sc-filter-result" Value="PROXIED" />
<Data Name="x-icap-error-code" Value="none" />
</Resource>
</Payload>
</Receive>
</EventDetail>
</Event>
</Events>
for the given input
<?xml version="1.1" encoding="UTF-8"?>
<records xmlns="records:2" xmlns:xsi="http://www.w3.org/2001/XMLSchema-instance" xsi:schemaLocation="records:2 file://records-v2.0.xsd" version="2.0">
<record>
<data name="date" value="2005-05-04" />
<data name="time" value="17:16:12" />
<data name="time-taken" value="1" />
<data name="c-ip" value="45.110.2.82" />
<data name="sc-status" value="200" />
<data name="s-action" value="TCP_HIT" />
<data name="sc-bytes" value="941" />
<data name="cs-bytes" value="729" />
<data name="cs-method" value="GET" />
<data name="cs-uri-scheme" value="http" />
<data name="cs-host" value="www.inmobus.com" />
<data name="cs-uri-path" value="/wcm/assets/images/imagefileicon.gif" />
<data name="cs-uri-query" value="-" />
<data name="cs-username" value="george" />
<data name="s-hierarchy" value="DIRECT" />
<data name="s-supplier-name" value="38.112.92.20" />
<data name="rs(Content-Type)" value="image/gif" />
<data name="cs(User-Agent)" value="Mozilla/4.0 (compatible; MSIE 6.0; Windows NT 5.1; SV1; .NET CLR 1.1.4322)" />
<data name="sc-filter-result" value="PROXIED" />
<data name="sc-filter-category" value="none" />
<data name="x-virus-id" value="-" />
<data name="s-ip" value="192.16.170.42" />
<data name="s-sitename" value="SG-HTTP-Service" />
<data name="x-virus-details" value="-" />
<data name="x-icap-error-code" value="none" />
<data name="x-icap-error-details" value="-" />
</record>
</records>
Do not forget to Save
 the translation as we are complete.
Schema Validation
One last point, validating the use of the Stroom Event Logging Schema is performed in the schemaFilter component of the pipeline.
Had our translation resulted in a malformed Event, this pipeline component displays any errors.
In the screen below, we have purposely changed the EventTime/TimeCreated element to be EventTime/TimeCreatd.
If one selects the schemaFilter component and then Refresh
 the current step, we will see that
-
there is an error as indicated by a square Red box
 in the top right hand corner
-
there is a Red rectangle line indicator mark
 on the right hand side in the display slide bar
-
there is a Red error marker
 in the left hand gutter.
Hovering over the error marker
 on the left hand side will bring a pop-up describing the error.
At this point, close the BlueCoat-Proxy-V1.0-EVENTS stepping tab, acknowledging you do not want to save your errant changes
by pressing the
Ok
button.
Automated Processing
Now that we have authored our translation, we want to enable Stroom to automatically process streams of raw event log data as it arrives.
We do this by configuring a Processor in the BlueCoat-Proxy-V1.0-EVENTS pipeline.
Adding a Pipeline Processor
Open the BlueCoat-Proxy-V1.0-EVENTS pipeline by selecting it (double left click) in the Explorer display to show
To configure a Processor we select the Processors hyper-link of the BlueCoat-Proxy-V1.0-EVENTS Pipeline tab to reveal
We add a Processor by pressing the add processor button
 in the top left hand corner.
At this you will be presented with an
 Add Filter configuration window.
As we wish to create a Processor that will automatically process all BlueCoat-Proxy-V1.0-EVENTS feed Raw Events we will select the BlueCoat-Proxy-V1.0-EVENTS Feed and Raw Event Stream Type.
To select the feed, we press the Edit button
 .
At this, the
 Choose Feeds To Include And Exclude configuration window is displayed.
As we need to Include the BlueCoat-Proxy-V1.0-EVENTS Feed in our selection, press the
 button in the
 Include: pane of the window to be presented with a Choose Item configuration window.
Navigate to the Event Sources/Proxy/BlueCoat folder and select the BlueCoat-Proxy-V1.0-EVENTS Feed
then press the
Ok
button to select and see that the feed is included.
Again press the
Ok
button to close the Choose Feeds To Include And Exclude window to show that we have selected our feed in the Feeds: selection pane of the Add Filter configuration window.
We now need to select our Stream Type.
Press the
 button in the
 Stream Types: pane of the window to be presented with a Add Stream Type window with a Stream Type: selection drop down.
We select (left click) the drop down selection to display the types of Stream we can choose
and as we are selecting Raw Events we select that item then press the
Ok
button at which we see that our Add Filter configuration window displays
As we have selected our filter items, press the
Ok
button to display our configured Processors.
We now see our display is divided into two panes.
The Processors table pane at the top and the specific Processor pane below.
In our case, our filter selection has left the BlueCoat-Proxy-V1.0-EVENTS Filter selected in the Processors table
and the specific filter’s details in the bottom pane.
The column entries in the Processors Table pane describe
- Pipeline - the name of the Processor pipeline (
 )
)
- Tracker Ms - the last time the tracker updated
- Tracker % - the percentage of available streams completed
- Last Poll Age - the last time the processor found new streams to process
- Task Count - the number of processor tasks currently running
- Priority - the queue scheduling priority of task submission to available stream processors
- Streams - the number of streams that have been processed (includes currently running streams)
- Events - ??
- Status - the status of the processor.
- Normally empty if the number of stream is open-ended.
- If only are subset of streams were chosen (e.g. a time range in the filter) then the status will be Complete
- Enabled - check box to indicate the processor is enabled
We now need only Enable both the pipeline Processor and the pipeline Filter for automatic processing to occur.
We do this by selecting both check boxes in the Enabled column.
If we refresh our Processor table by pressing the
 button in the top right hand corner, we will see that more table entries have been filled in.
We see that the tracker last updated at 2018-07-14T04:00:35.289Z, the percentage complete is 100 (we only had one stream after all), the last time active streams were checked for was 2.3 minutes ago, there are no tasks running and that 1 stream has completed.
Note that the Status column is blank as we have an open ended filter in that the processor will continue to select and process any new stream of Raw Events coming into the BlueCoat-Proxy-V1.0-EVENTS feed.
If we return to the BlueCoat-Proxy-V1.0-EVENTS* Feed tab, ensuring the Data hyper-link is selected and then refresh (
 ) the top pane that holds the summary of the latest Feed streams
We see a new entry in the table.
The columns display
- Created - The time the stream was created.
- Type - The type of stream.
Our new entry has a type of ‘Events’ as we have processed our
Raw Events data.
- Feed - The name of the stream’s feed
- Pipeline - The name of the pipeline involved in the generation of the stream
- Raw - The size in bytes of the raw stream data
- Disk - The size in bytes of the raw stream data when stored in compressed form on the disk
- Read - The number of records read by a pipeline
- Write - The number of records (events) written by a pipeline.
In this case the difference is that we did not generate events for the
Software or Version records we read.
- Fatal - The number of fatal errors the pipeline encountered when processing this stream
- Error - The number of errors the pipeline encountered when processing this stream
- Warn - The number of warnings the pipeline encountered when processing this stream
- Info - The number of informational alerts the pipeline encountered when processing this stream
- Retention - The retention period for this stream of data
If we also refresh (
 ) the specific feed pane (middle) we again see a new entry of the
 Events Type
If we select (left click) on the Events Type in either pane, we will see that the data pane displays the first event in the GCHQ Stroom Event Logging XML Schema form.
We can now send a file of BlueCoat Proxy logs to our Stroom instance from a Linux host using curl command and see how Stroom will automatically processes the file.
Use the command
After Stroom’s Proxy aggregation has occurred, we will see that the new file posted via curl has been loaded into Stroom as per
and this new Raw Event stream is automatically processed a few seconds later as per
We note that since we have used the same sample file again, the Stream sizes and record counts are the same.
If we switch to the Processors tab of the pipeline we see that the Tracker timestamp has changed and the number of Streams processed has increased.
6 - Reference Feeds
6.1 - Use a Reference Feed
How to use a reference data feed to perform temporal lookups to enrich events.
Introduction
Reference feeds are temporal stores of reference data that a translation can look up to enhance an Event with additional data.
For example, rather than storing a person’s full name and phone number in every event, we can just store their user id and, based on this value, look up the associated user data and decorate the event.
In the description below, we will make use of the GeoHost-V1.0-REFERENCE reference feed defined in separate HOWTO document.
Using a Reference Feed
To use a Reference Feed, one uses the Stroom xslt function stroom:lookup().
This function is found within the xml namespace xmlns:stroom=“stroom”.
The lookup function has two mandatory arguments and three optional as per
- lookup(String map, String key) Look up a reference data map using the period start time
- lookup(String map, String key, String time) Look up a reference data map using a specified time, e.g. the event time
- lookup(String map, String key, String time, Boolean ignoreWarnings) Look up a reference data map using a specified time, e.g. the event time, and ignore any warnings generated by a failed lookup
- lookup(String map, String key, String time, Boolean ignoreWarnings, Boolean trace) Look up a reference data map using a specified time, e.g. the event time, ignore any warnings generated by a failed lookup and get trace information for the path taken to resolve the lookup.
Let’s say, we have the Event fragment
<Event>
<EventTime>
<TimeCreated>2020-01-18T20:39:04.000Z</TimeCreated>
</EventTime>
<EventSource>
<System>
<Name>LinuxWebServer</Name>
<Environment>Production</Environment>
</System>
<Generator>Apache HTTPD</Generator>
<Device>
<HostName>stroomnode00.strmdev00.org</HostName>
<IPAddress>192.168.2.245</IPAddress>
</Device>
<Client>
<IPAddress>192.168.4.220</IPAddress>
<Port>61801</Port>
</Client>
<Server>
<HostName>stroomnode00.strmdev00.org</HostName>
<Port>443</Port>
</Server>
...
</EventSource>
then the following XSLT would lookup our GeoHost-V1.0-REFERENCE Reference map to find the FQDN of our client
<xsl:variable name="chost" select="stroom:lookup('IP_TO_FQDN', data[@name = 'clientip']/@value)" />
And the XSLT to find the IP Address for our Server would be
<xsl:variable name="sipaddr" select="stroom:lookup('FQDN_TO_IP', data[@name = 'vserver']/@value)" />
In practice, one would also pass the time element as well as setting ignoreWarnings to true(). i.e.
<xsl:variable name="chost" select="stroom:lookup('IP_TO_FQDN', data[@name = 'clientip']/@value, $formattedDate, true())" />
...
<xsl:variable name="sipaddr" select="stroom:lookup('FQDN_TO_IP', data[@name = 'vserver']/@value, $formattedDate, true())" />
Modifying an Event Feed to use a Reference Feed
We will now modify an Event feed to have it lookup our GeoHost-V1.0-REFERENCE reference maps to add additional information to the event.
The feed for this exercise is the Apache-SSL-BlackBox-V2.0-EVENTS event feed which processes Apache HTTPD SSL logs which make use of a variation on the BlackBox log format.
We will step through a Raw Event stream and modify the translation directly.
This way, we see the changes directly.
Using the Explorer pane’s Quick Filter, entry box, we will find the Apache feed.
First, select the Quick Filter text entry box and type Apache (the Quick Filter is case insensitive).
At this you will see the Explorer pane system group structure reduce down to just the Event Sources.
The Explorer pane will display any resources that match our Apache string.
Double clicking on the
 Apache-SSL-BlackBox-V2.0-EVENTS Feed will select it, and bring up the Feed’s tab in the main window.
We click on the tab’s Data sub-item and then select the most recent Raw Events stream.
Now, select the check box on the Raw Events stream in the Specific Stream (middle) pane.
Note that, when we check the box, we see that the Process, Delete and Download icons (


 ) are enabled.
We enter Stepping Mode by pressing the stepping button found at the bottom right corner of the Data/Meta-data pane.
You will then be requested to choose a pipeline to step with, with the selection already pre-selected
This auto pre-selection is a simple pattern matching action by Stroom.
Press OK to start the stepping which displays the pipeline stepping tab
Select the
 translationFilter
element to reveal the translation we plan to modify.
To bring up the first event from the stream, press the Step Forward button
 to show
We scroll the translation pane to show the XSLT segment that deals with the and elements
and also scroll the translation output pane to display the and elements
We modify the Client xslt segment to change
<Client>
<IPAddress>
<xsl:value-of select="data[@name = 'clientip']/@value" />
</IPAddress>
<Port>
<xsl:value-of select="data[@name = 'clientport']/@value" />
</Port>
</Client>
to
<Client>
<xsl:variable name="chost" select="stroom:lookup('IP_TO_FQDN', data[@name = 'clientip']/@value)" />
<xsl:if test="$chost">"
<HostName>
<xsl:value-of select="$chost" />
</HostName>
</xsl:if>
<IPAddress>
<xsl:value-of select="data[@name = 'clientip']/@value" />
</IPAddress>
<xsl:if test="data[@name = 'clientport']/@value !='-'">
<Port>
<xsl:value-of select="data[@name = 'clientport']/@value" />
</Port>
</xsl:if>
</Client>
and then we press the Refresh Current Step icon
 .
.
BUT NOTHING CHANGES !!!
Not quite, you will note in the top right of the translation pane some yellow boxes.
If you click on the top square box, you will see the WARN: 1 selection window
Clicking on the yellow rectangle box below the yellow square box, the translation pane will automatically scroll back to the top of the translation and show the
 icon.
icon.
Clicking on the
 icon will reveal the actual warning message.
The problem is that, the pipeline cannot find the Reference.
To allow a pipeline to find reference feeds, we need to modify the translation parameters within the pipeline.
The pipeline for this Event feed is called APACHE-SSLBlack-Box-V2.0-EVENTS.
Open this pipeline by double clicking on its entry in the Explorer window
then switch to the Structure sub-item
and then select the
 translationFilter
element to reveal
The top pane shows the pipeline, in this case, the selected translation filter
 element of the pipeline.
The middle pane shows the Properties for this element - we see that it has an xslt property of the
 APACHE-BlackBoxV2.0-EVENTS translation.
The bottom pane is the one we are interested in.
In the case of translation Filters, this pane allows one to associate Reference streams with the translation Filter.
So, to associate our GeoHost-V1.0-REFERENCE reference feed with this translation filter, click on the
 New Reference icon to bring up the New Pipeline Reference selection window
For Pipeline: use the menu selector
 and choose the Reference Loader pipeline and then press OK
For Feed:, navigate to the reference feed we want, that is the GeoHost-V1.0-REFERENCE reference feed and press OK
And finally, for Stream Type: choose Reference from the drop-down menu
then press OK to save the new reference.
We now see
Save these pipeline changes by pressing the
 icon in the top left then switch back to the APACHE-SSLBlackBox-V2.0-EVENTS stepping tab.
Pressing the Refresh Current Step
 icon will remove the warning and we now note that the output pane now shows the
 <Client/HostName> element.
To complete the translation, we will add reference lookups for the <Server/HostName> element and we will also add <Location> elements to both the <Client> and <Server> elements.
The completed code segment looks like
...
<!-- Set some variables to enable lookup functionality -->
<xsl:variable name="formattedDate" select="stroom:format-date(data[@name = 'time']/@value, 'dd/MMM/yyyy:HH:mm:ss XX')" />
<!-- For Version 2.0 of Apache audit we have the virtual server, so this will be our server -->
<xsl:variable name="vServer" select="data[@name = 'vserver']/@value" />
<xsl:variable name="vServerPort" select="data[@name = 'vserverport']/@value" />
...
<!-- -->
<Client>
<!-- See if we can get the client HostName from the given IP address -->
<xsl:variable name="chost" select="stroom:lookup('IP_TO_FQDN',data[@name = 'host']/@value, $formattedDate, true())" />
<xsl:if test="$chost">
<HostName>
<xsl:value-of select="$chost" />
</HostName>
</xsl:if>
<IPAddress>
<xsl:value-of select="data[@name = 'clientip']/@value" />
</IPAddress>
<xsl:if test="data[@name = 'clientport']/@value !='-'">
<Port>
<xsl:value-of select="data[@name = 'clientport']/@value" />
</Port>
</xsl:if>
<!-- See if we can get the client Location for the client FQDN if we have it -->
<xsl:variable name="cloc" select="stroom:lookup('FQDN_TO_LOC', $chost, $formattedDate, true())" />
<xsl:if test="$chost != '' and $cloc">
<xsl:copy-of select="$cloc" />
</xsl:if>
</Client>
<!-- -->
<Server>
<HostName>
<xsl:value-of select="$vServer" />
</HostName>
<!-- See if we can get the service IPAddress -->
<xsl:variable name="sipaddr" select="stroom:lookup('FQDN_TO_IP',$vServer, $formattedDate, true())" />
<xsl:if test="$sipaddr">
<IPAddress>
<xsl:value-of select="$sipaddr" />
</IPAddress>
</xsl:if>
<!-- Server Port Number -->
<xsl:if test="$vServerPort !='-'">
<Port>
<xsl:value-of select="$vServerPort" />
</Port>
</xsl:if>
<!-- See if we can get the Server location -->
<xsl:variable name="sloc" select="stroom:lookup('FQDN_TO_LOC', $vServer, $formattedDate, true())" />
<xsl:if test="$sloc">
<xsl:copy-of select="$sloc" />
</xsl:if>
</Server>
Once the above modifications have been made to the XSLT, save these by pressing the
 icon in the top left corner of the pane.
Note the use of the fourth Boolean ignoreWarnings argument in the lookups.
We set this to true() as we may not always have the item in the reference map we want and Warnings consume space in the Stroom store file system.
Thus, the fragment from the output pane for our first event shows
and the fragment from the output pane for our last event of this stream shows
This is the XSLT Translation.
<?xml version="1.0" encoding="UTF-8" ?>
<xsl:stylesheet xpath-default-namespace="records:2" xmlns="event-logging:3" xmlns:stroom="stroom" xmlns:xsl="http://www.w3.org/1999/XSL/Transform" xmlns:xsi="http://www.w3.org/2001/XMLSchema-instance" xmlns:xs="http://www.w3.org/2001/XMLSchema" version="3.0">
<!-- Ingest the records tree -->
<xsl:template match="records">
<Events xsi:schemaLocation="event-logging:3 file://event-logging-v3.2.3.xsd" Version="3.2.3">
<xsl:apply-templates />
</Events>
</xsl:template>
<!-- Only generate events if we have an url on input -->
<xsl:template match="record[data[@name = 'url']]">
<Event>
<xsl:apply-templates select="." mode="eventTime" />
<xsl:apply-templates select="." mode="eventSource" />
<xsl:apply-templates select="." mode="eventDetail" />
</Event>
</xsl:template>
<xsl:template match="node()" mode="eventTime">
<EventTime>
<TimeCreated>
<xsl:value-of select="stroom:format-date(data[@name = 'time']/@value, 'dd/MMM/yyyy:HH:mm:ss XX')" />
</TimeCreated>
</EventTime>
</xsl:template>
<xsl:template match="node()" mode="eventSource">
<!-- Set some variables to enable lookup functionality -->
<xsl:variable name="formattedDate" select="stroom:format-date(data[@name = 'time']/@value, 'dd/MMM/yyyy:HH:mm:ss XX')" />
<!-- For Version 2.0 of Apache audit we have the virtual server, so this will be our server -->
<xsl:variable name="vServer" select="data[@name = 'vserver']/@value" />
<xsl:variable name="vServerPort" select="data[@name = 'vserverport']/@value" />
<EventSource>
<System>
<Name>
<xsl:value-of select="stroom:feed-attribute('System')" />
</Name>
<Environment>
<xsl:value-of select="stroom:feed-attribute('Environment')" />
</Environment>
</System>
<Generator>Apache HTTPD</Generator>
<Device>
<HostName>
<xsl:value-of select="stroom:feed-attribute('MyHost')" />
</HostName>
<IPAddress>
<xsl:value-of select="stroom:feed-attribute('MyIPAddress')" />
</IPAddress>
</Device>
<Client>
<xsl:variable name="chost" select="stroom:lookup('IP_TO_FQDN', data[@name = 'clientip']/@value, $formattedDate, true())" />
<xsl:if test="$chost">
<HostName>
<xsl:value-of select="$chost" />
</HostName>
</xsl:if>
<IPAddress>
<xsl:value-of select="data[@name = 'clientip']/@value" />
</IPAddress>
<xsl:if test="data[@name = 'clientport']/@value !='-'">
<Port>
<xsl:value-of select="data[@name = 'clientport']/@value" />
</Port>
</xsl:if>
<xsl:variable name="cloc" select="stroom:lookup('FQDN_TO_LOC', $chost, $formattedDate, true())" />
<xsl:if test="$chost != '' and $cloc">
<xsl:copy-of select="$cloc" />
</xsl:if>
</Client>
<Server>
<HostName>
<xsl:value-of select="$vServer" />
</HostName>
<!-- See if we can get the service IPAddress -->
<xsl:variable name="sipaddr" select="stroom:lookup('FQDN_TO_IP',$vServer, $formattedDate, true())" />
<xsl:if test="$sipaddr">
<IPAddress>
<xsl:value-of select="$sipaddr" />
</IPAddress>
</xsl:if>
<!-- Server Port Number -->
<xsl:if test="$vServerPort !='-'">
<Port>
<xsl:value-of select="$vServerPort" />
</Port>
</xsl:if>
<!-- See if we can get the Server location -->
<xsl:variable name="sloc" select="stroom:lookup('FQDN_TO_LOC', $vServer, $formattedDate, true())" />
<xsl:if test="$sloc">
<xsl:copy-of select="$sloc" />
</xsl:if>
</Server>
<User>
<Id>
<xsl:value-of select="data[@name='user']/@value" />
</Id>
</User>
</EventSource>
</xsl:template>
<xsl:template match="node()" mode="eventDetail">
<EventDetail>
<TypeId>SendToWebService</TypeId>
<Description>Send/Access data to Web Service</Description>
<Classification>
<Text>UNCLASSIFIED</Text>
</Classification>
<Send>
<Source>
<Device>
<IPAddress>
<xsl:value-of select="data[@name = 'clientip']/@value"/>
</IPAddress>
<Port>
<xsl:value-of select="data[@name = 'vserverport']/@value"/>
</Port>
</Device>
</Source>
<Destination>
<Device>
<HostName>
<xsl:value-of select="data[@name = 'vserver']/@value"/>
</HostName>
<Port>
<xsl:value-of select="data[@name = 'vserverport']/@value"/>
</Port>
</Device>
</Destination>
<Payload>
<Resource>
<URL>
<xsl:value-of select="data[@name = 'url']/@value"/>
</URL>
<Referrer>
<xsl:value-of select="data[@name = 'referer']/@value"/>
</Referrer>
<HTTPMethod>
<xsl:value-of select="data[@name = 'url']/data[@name = 'httpMethod']/@value"/>
</HTTPMethod>
<HTTPVersion>
<xsl:value-of select="data[@name = 'url']/data[@name = 'version']/@value"/>
</HTTPVersion>
<UserAgent>
<xsl:value-of select="data[@name = 'userAgent']/@value"/>
</UserAgent>
<InboundSize>
<xsl:value-of select="data[@name = 'bytesIn']/@value"/>
</InboundSize>
<OutboundSize>
<xsl:value-of select="data[@name = 'bytesOut']/@value"/>
</OutboundSize>
<OutboundContentSize>
<xsl:value-of select="data[@name = 'bytesOutContent']/@value"/>
</OutboundContentSize>
<RequestTime>
<xsl:value-of select="data[@name = 'timeM']/@value"/>
</RequestTime>
<ConnectionStatus>
<xsl:value-of select="data[@name = 'constatus']/@value"/>
</ConnectionStatus>
<InitialResponseCode>
<xsl:value-of select="data[@name = 'responseB']/@value"/>
</InitialResponseCode>
<ResponseCode>
<xsl:value-of select="data[@name = 'response']/@value"/>
</ResponseCode>
<Data Name="Protocol">
<xsl:attribute select="data[@name = 'url']/data[@name = 'protocol']/@value" name="Value"/>
</Data>
</Resource>
</Payload>
<!-- Normally our translation at this point would contain an <Outcome> attribute.
Since all our sample data includes only successful outcomes we have ommitted the <Outcome> attribute
in the translation to minimise complexity-->
</Send>
</EventDetail>
</xsl:template>
</xsl:stylesheet>
Troubleshooting lookup issues
If your lookup is not working as expected you can use the 5th argument of the lookup function to help investigate the issue.
If we return to the
 element of the pipeline and change the xslt from
<Client>
<xsl:variable name="chost" select="stroom:lookup('IP_TO_FQDN', data[@name = 'clientip']/@value, $formattedDate, true())" />
to
<Client>
<xsl:variable name="chost" select="stroom:lookup('IP_TO_FQDN', data[@name = 'clientip']/@value, $formattedDate, true(), true())" />
and then we press the Refresh Current Step icon

you will notice the two blue squares at the top right of the code pane
If you click on the lower blue square then the code screen will reposition to the beginning of the xslt.
Note the
 icon at the top left of the screen.
If you hover over this information icon you will
see information about the path taken to resolve the lookup.
Hopefully this additional information guides resolution of the lookup issue.
Once you have completed your troubleshooting you can either remove the 5th argument from the lookup function, or set to false.
6.2 - Create a Simple Reference Feed
How to create a reference feed for decorating event data using reference data lookups.
Introduction
A Reference Feed is a temporal set of data that a pipeline’s translation can look up to gain additional information to decorate the subject data of the translation.
For example, an XML Event.
A Reference Feed is temporal, in that, each time a new set of reference data is loaded into Stroom, the effective date (for the data) is also recorded.
Thus by using a timestamp field with the subject data, the appropriate batch of reference data can be accessed.
A typical reference data set to support the Stroom XML Event schema might be on that relates to devices.
Such a data set can contain the device logical identifiers such as fully qualified domain name and ip address and their geographical location information such as country, site, building, room and timezone.
The following example will describe how to create a reference feed for such device data.
We will call the reference feed GeoHost-V1.0-REFERENCE.
Reference Data
Our reference data will be supplied in a separated file containing the fields
- the device Fully Qualified Domain Name
- the device IP Address
- the device Country location (using ISO 3166-1 alpha-3 codes)
- the device Site location
- the device Building location
- the device TimeZone location (both standard then daylight timezone offsets from UTC)
For simplicity, our example will use a file with just 5 entries
A copy of this sample data source can be found here.
Save a copy of this data to your local environment for use later in this HOWTO.
Save this file as a text document with ANSI encoding.
Creation
To create our Reference Event stream we need to create:
- the Feed
- a Pipeline to automatically process and store the Reference data
- a Text Parser to convert the text file into simple XML record format, and
- a Translation to create reference data maps
Create Feed
First, within the Explorer pane, and with the cursor having selected the Event Sources group, right click the mouse to have the object context menu appear.
If you hover over the
 New icon then the New sub-context menu will be revealed.
Now hover the mouse over the
 Feed icon and right click to select.
When the New Feed selection windows comes up, navigate to the Event Sources system group.
Then enter the name of the reference feed GeoHost-V1.0-REFERENCE onto the Name: text entry box.
On pressing the
Ok
button we will see the following Feed configuration tab appear.
Click on the Settings sub-item in the GeoHost-V1.0-REFERENCE Feed tab to populate the initial Settings configuration.
Enter an appropriate description, classification and click on the Reference Feed check box
and we then use the Stream Type drop-down menu to set the stream type as Raw Reference.
At this point we save our configuration so far, by clicking on the
 save icon.
The save icon becomes ghosted and our feed configuration has been saved.
Load sample Reference data
At this point we want to load our sample reference data, in order to develop our reference feed.
We can do this two ways - posting the file to our Stroom web server, or directly upload the data using the user interface.
For this example we will use Stroom’s user interface upload facility.
First, open the Data sub-item in the GeoHost-V1.0-REFERENCE feed configuration tab to reveal
Note the
 Upload icon in the bottom left of the Stream table (top pane).
On clicking the Upload icon, we are presented with the data upload selection window.
Naturally, as this is a reference feed we are creating and this is raw data we are uploading, we select a Stream Type: of Raw Reference.
We need to set the Effective: date (really a timestamp) for this specific stream of reference data.
Clicking in the Effective: entry box will cause a calendar selection window to be displayed (initially set to the current date).
We are going to set the effective date to be late in 2019.
Normally, you would choose a time stamp that matches the generation of the reference data.
Click on the blue Previous Month icon (a less than symbol <) on the Year/Month line to move back to December 2019.
Select the 1st (clicking on 1) at which point the calendar selection window will disappear and a time of 2019-12-01T00:00:00.000Z is displayed.
This is the default whenever using the calendar selection window in Stroom - the resultant timestamp is that of the day selected at 00:00:00 (Zulu time).
To get the calendar selection window to disappear, click anywhere outside of the timestamp entry box.
Note, if you happen to click on the
Ok
button before selecting the File (or Stream Type for that matter), an appropriate Alert dialog box will be displayed
We don’t need to set Meta Data for this stream of reference data, but we (obviously) need to select the file.
For the purposes of this example, we will utilise the file GeoHostReference.log you downloaded earlier in the Reference Data section of this document.
This file contains a header and five lines of reference data as per
When we construct the pipeline for this reference feed, we will see how to make use of the header line.
So, click on the Choose File button to bring up a file selector window.
Navigate within the selector window to the location on your location machine where you have saved the GeoHostReference.log file.
On clicking Open we return to the Upload window with the file selected.
On clicking
Ok
we get an Alert dialog window to advise a file has been uploaded.
at which point we press Close.
At this point, the Upload selection window closes, and we see our file displayed in the GeoHost-V1.0-REFERENCE Data stream table.
When we click on the newly up-loaded stream in the Stream Table pane we see the other two panes fill with information.
The middle pane shows the selected or Specific feed and any linked streams.
A linked stream could be the resultant Reference data set generated from a Raw Reference stream.
If errors occur during processing of the stream, then a linked stream could be an Error stream.
The bottom pane displays the selected stream’s data or meta-data.
If we click on the Meta link at the top of this pane, we will see the Metadata associated with this stream.
We also note that the Meta link at the bottom of the pane is now embolden.
We can see the metadata we set - the EffectiveTime, and implicitly, the Feed but we also see additional fields that Stroom has added that provide more detail about the data and its delivery to Stroom such as how and when it was received.
We now need to switch back to the Data display as we need to author our reference feed translation.
Create Pipeline
We now need to create the pipeline for our reference feed so that we can create our translation and hence create reference data for our feed.
Within the Explorer pane, and having selected the Event Sources system group, right click to bring up the object context menu, then the New sub-context menu.
Move to the
 and left click to select.
When the New Pipeline selection window appears, navigate to, then select the
 Feeds and Translations system group then enter the name of the reference feed, GeoHost-V1.0-REFERENCE in the Name: text entry box.
On pressing the
Ok
button you will be presented with the new pipeline’s configuration tab
Within Settings, enter an appropriate description as per
We now need to select the structure this pipeline will use.
We need to move from the Settings sub-item on the pipeline configuration tab to the Structure sub-item.
This is done by clicking on the Structure link, at which we will see
As this pipeline will be processing reference data, we would use a Reference Data pipeline.
This is done by inheriting it from a defined set of Standard Pipelines.
To do this, click on the menu selection icon
 to the right of the Inherit From: test display box.
When the Choose item selection window appears, navigate to the Template Pipelines system group (if not already displayed), and select (left click) the

Reference Data pipeline.
You can find further information about the Template Pipelines
here
.
Then press
Ok
.
At this we will see the inherited pipeline structure of
Noting that this pipeline has not yet been saved - indicated by the * in the tab label and the highlighted
 to save, which results in
This ends the first stage of the pipeline creation.
We need to author the feed’s translation.
Create Text Converter
To turn our tab delimited data in Stroom reference data, we first need to convert the text into simple XML.
We do this using a Text Converter. Test Converters use a Stroom Data Splitter to convert text into simple XML.
Within the Explorer pane, and having selected the Event Sources system group, right click to bring up the object context menu.
Navigate to the
 item and left click to select.
When the New Text Converter selection window comes up, navigate to and select Event Sources system group, then enter the name of the feed, GeoHost-V1.0-REFERENCE into the Name: text entry box as per
On pressing the
Ok
button we see the next text converter’s configuration tab displayed.
Enter an appropriate description into the Description: text entry box, for instance
Text converter for device Logical and Geographic reference feed holding FQDN, IPAddress, Country, Site, Building, Room and Time Zones.
Feed has a header and is tab separated.
Set the Converter Type: to be Data Splitter from the drop-down menu.
We next press the Conversion sub-item on the TextConverter tab to bring up the Data Splitter editing window.
The following is our Data Splitter code (see Data Splitter documentation for more complete details)
<?xml version="1.1" encoding="UTF-8"?>
<dataSplitter xmlns="data-splitter:3" xmlns:xsi="http://www.w3.org/2001/XMLSchema-instance" xsi:schemaLocation="data-splitter:3 file://data-splitter-v3.0.1.xsd" version="3.0">
<!--
GEOHOST REFERENCE FEED:
CHANGE HISTORY
v1.0.0 - 2020-02-09 John Doe
This is a reference feed for device Logical and Geographic data.
The feed provides for each device
* the device FQDN
* the device IP Address
* the device Country location (using ISO 3166-1 alpha-3 codes)
* the device Site location
* the device Building location
* the device Room location
*the device TimeZone location (both standard then daylight timezone offsets from UTC)
The data is a TAB delimited file with the first line providing headings.
Example data:
FQDN IPAddress Country Site Building Room TimeZones
stroomnode00.strmdev00.org 192.168.2.245 GBR Bristol-S00 GZero R00 +00:00/+01:00
stroomnode01.strmdev01.org 192.168.3.117 AUS Sydney-S04 R6 5-134 +10:00/+11:00
host01.company4.org 192.168.4.220 USA LosAngeles-S19 ILM C5-54-2 -08:00/-07:00
-->
<!-- Match the heading line - split on newline and match a maximum of one line -->
<split delimiter="\n" maxMatch="1">
<!-- Store each heading and note we split fields on the TAB (	) character -->
<group>
<split delimiter="	">
<var id="heading"/>
</split>
</group>
</split>
<!-- Match all other data lines - splitting on newline -->
<split delimiter="\n">
<group>
<!-- Store each field using the column heading number for each column ($heading$1) and note we split fields on the TAB (	) character -->
<split delimiter="	">
<data name="$heading$1" value="$1"/>
</split>
</group>
</split>
</dataSplitter>
At this point we want to save our Text Converter, so click on the
 icon.
icon.
A copy of this data splitter can be found here.
Assign Text Converter to Pipeline
To test our Text Converter, we need to modify our GeoHost-V1.0-REFERENCE pipeline to use it.
Select the GeoHost-V1.0-REFERENCE pipeline tab and then select the Structure sub-item
To associate our new Text Converter with the pipeline, click on the
 combinedParser
pipeline element then move the cursor to the Property (middle) pane then double click on the textConverter Property Name to allow you to edit the property as per
We leave the Property Source: as Inherit but we need to change the Property Value: from None to be our newly created GeoHost-V1.0-REFERENCE text Converter
then press
Ok
.
At this we will see the Property Value set
Again press
Ok
to finish editing this property and we then see that the textConverter property has been set to GeoHost-V1.0-REFERENCE.
Similarly set the type property Value to “Data Splitter”.
At this point, we should save our changes, by clicking on the highlighted
 icon.
The combined Parser window panes should now look like
Test Text Converter
To test our Text Converter, we select the
 GeoHost-V1.0-REFERENCE
×
tab then click on our uploaded stream in the Stream Table pane, then click the check box of the Raw Reference stream in the Specific Stream table (middle pane)
We now want to step our data through the Text Converter.
We enter Stepping Mode by pressing the stepping button
 found at the bottom of the right of the stream Raw Data display.
You will then be requested to choose a pipeline to step with, at which, you should navigate to the GeoHost-V1.0-REFERENCE pipeline as per
then press
Ok
.
At this point we enter the pipeline Stepping tab
which initially displays the Raw Reference data from our stream.
We click on the
 combinedParser
icon, to display.
This stepping window is divided into three sub-panes. the top one is the Text Converter editor and it will allow you to adjust the text conversion should you wish too.
The bottom left window displays the input to the Text Converter.
The bottom right window displays the output from the Text Converter for the given input.
We now click on the pipeline Step Forward button
 to single step the Raw reference data throughout text converter.
We see that the Stepping function has displayed the heading and first data line of our raw reference data in the input sub-pane and the resultant simple records XML (adhering to the Stroom records v2.0 schema) in the output pane.
If we again press the
 button we see the second line in our raw reference data in the input sub-pane and the resultant simple records XML in the output pane.
Pressing the Step Forward button
 again displays our third line of our raw and converted data.
Repeat this process to view the fourth and fifth lines of converted data.
We have now successfully tested the Text Converter for our reference feed.
Our next step is to author our translation to generate reference data records that Stroom can use.
Create XSLT Translation
We now need to create our translation.
This XSLT translation will convert simple records XML data into ReferenceData records - see the Stroom reference-data v2.0.1 Schema for details.
More information can be found
here
.
We first need to create an XSLT translation for our feed.
Move back to the Explorer tree, right click on
 Event Sources folder then select:
 New =>
 XSLT.
XSLT.
When the New XSLT selection window comes up, navigate to the Event Sources system group and enter the name of the reference feed - GeoHost-V1.0-REFERENCE into the Name: text entry box as per
On pressing the
Ok
button we see the XSL tab for our translation and as previously, we enter an appropriate description before selecting the XSLT sub-item.
On selection of the XSLT sub-item, we are presented with the XSLT editor window
At this point, rather than edit the translation in this editor and then assign this translation to the GeoHost-V1.0-REFERENCE pipeline, we will first make the assignment in the pipeline and then develop the translation whilst stepping through the raw data.
This is to demonstrate there are a number of ways to develop a translation.
So, to start, save the XSLT by clicking on the
 GeoHost-V1.0-REFERENCE Pipeline
×
tab to raise the GeoHost-V1.0-REFERENCE pipeline.
Then select the Structure sub-item followed by selecting the
 translationFilter
element.
We now see the XSL translationFilter Property Table for our pipeline in the middle pane.
To associate our new translation with the pipeline, move the cursor to the Property Table, click on the grayed out xslt Property Name and then click on the Edit Property
 icon to allow you to edit the property as per
We leave the Property Source: as Inherit and we need to change the Property Value: from None to be our newly created GeoHost-V1.0-REFERENCE XSL translation.
To do this, position the cursor over the menu selection icon
 of the Value: chooser and right click, at which the
 Choose item selection window appears.
Navigate to the Event Sources system group then select the GeoHost-V1.0-REFERENCE xsl translation.
then press
Ok
.
At this point we will see the property Value: set
Again press
Ok
to finish editing this property and we see that the xslt property has been set to GeoHost-V1.0-REFERENCE.
At this point, we should save our changes, by clicking on the highlighted
 save icon.
Test XSLT Translation
We now go back to the
 GeoHost-V1.0-REFERENCE
×
tab then click on our uploaded stream in the Stream Table pane.
Next click the check box of the Raw Reference stream in the Specific Stream table (middle pane) as per
We now want to step our data through the xslt Translation.
We enter Stepping Mode by pressing the stepping button
 found at the bottom of the right of the stream Raw Data display.
You will then be requested to choose a pipeline to step with, at which, you should navigate to the GeoHost-V1.0-REFERENCE pipeline as per
then press
Ok
.
At this point we enter the pipeline through the Stepping tab
which initially displays the Raw Reference data from our stream.
We click on the
 translationFilter
element to enter the xslt Translation stepping window and all panes are empty.
As for the Text Converter, this translation stepping window is divided into three sub-panes.
The top one is the XSLT Translation.
The bottom right window displays the output from the XSLT Translation for the given input.
We now click on the pipeline Step Forward button
 to single step the Raw reference data through our translation.
We see that the Stepping function has displayed the first records XML entry in the input sub-pane and the same data is displayed in the output sub-pane.
But we also note if we move along the pipeline structure to the
 icon.
icon.
In essence, since the translation has done nothing, and the data is simple records XML, the system is indicating that it expects the output data to be in the reference-data v2.0.1 format.
We can correct this by adding the skeleton xslt translation for reference data into our translationFilter.
Move back to the
 translationFilter
element on the pipeline structure and add the following to the xsl window.
<?xml version="1.1" encoding="UTF-8" ?>
<xsl:stylesheet xpath-default-namespace="records:2"
xmlns="reference-data:2"
xmlns:xsl="http://www.w3.org/1999/XSL/Transform"
xmlns:xsi="http://www.w3.org/2001/XMLSchema-instance"
xmlns:stroom="stroom"
xmlns:evt="event-logging:3"
version="2.0">
<xsl:template match="records">
<referenceData xmlns="reference-data:2"
xsi:schemaLocation="reference-data:2 file://reference-data-v2.0.xsd" version="2.0.1"
xmlns:xsi="http://www.w3.org/2001/XMLSchema-instance">
<xsl:apply-templates/>
</referenceData>
</xsl:template>
<!-- MAIN TEMPLATE -->
<xsl:template match="record">
<reference>
<map></map>
<key></key>
<value></value>
</reference>
</xsl:template>
</xsl:stylesheet>
And on pressing the refresh button
 we see that the output window is an empty ReferenceData element.
Also note that if we move to the
 schemaFilterSplit
element on the pipeline structure, we no longer have an “Invalid Schema Location” error.
We next extend the translation to actually generate reference data.
The translation will now look like
<?xml version="1.1" encoding="UTF-8" ?>
<xsl:stylesheet xpath-default-namespace="records:2"
xmlns="reference-data:2"
xmlns:xsl="http://www.w3.org/1999/XSL/Transform"
xmlns:xsi="http://www.w3.org/2001/XMLSchema-instance"
xmlns:stroom="stroom"
xmlns:evt="event-logging:3"
version="2.0">
<!--
GEOHOST REFERENCE FEED:
CHANGE HISTORY
v1.0.0 - 2020-02-09 John Doe
This is a reference feed for device Logical and Geographic data.
The feed provides for each device
* the device FQDN
* the device IP Address
* the device Country location (using ISO 3166-1 alpha-3 codes)
* the device Site location
* the device Building location
* the device Room location
*the device TimeZone location (both standard then daylight timezone offsets from UTC)
The reference maps are
FQDN_TO_IP - Fully Qualified Domain Name to IP Address
IP_TO_FQDN - IP Address to FQDN (HostName)
FQDN_TO_LOC - Fully Qualified Domain Name to Location element
-->
<xsl:template match="records">
<referenceData xmlns="reference-data:2"
xsi:schemaLocation="reference-data:2 file://reference-data-v2.0.xsd" version="2.0.1">
<xsl:apply-templates/>
</referenceData>
</xsl:template>
<!-- MAIN TEMPLATE -->
<xsl:template match="record">
<!-- FQDN_TO_IP map -->
<reference>
<map>FQDN_TO_IP</map>
<key>
<xsl:value-of select="lower-case(data[@name='FQDN']/@value)" />
</key>
<value>
<IPAddress>
<xsl:value-of select="data[@name='IPAddress']/@value" />
</IPAddress>
</value>
</reference>
<!-- IP_TO_FQDN map -->
<reference>
<map>IP_TO_FQDN</map>
<key>
<xsl:value-of select="lower-case(data[@name='IPAddress']/@value)" />
</key>
<value>
<HostName>
<xsl:value-of select="data[@name='FQDN']/@value" />
</HostName>
</value>
</reference>
</xsl:template>
</xsl:stylesheet>
and when we refresh, by pressing the Refresh Current Step button
 we see that the output window now has Reference elements within the parent ReferenceData element
If we press the Step Forward button
 we see the second record of our raw reference data in the input sub-pane and the resultant Reference elements
At this point it would be wise to save our translation.
This is done by clicking on the highlighted
 icon in the top left-hand area of the window under the tabs.
We can now further our Reference by adding a Fully Qualified Domain Name to Location reference - FQDN_TO_LOC and so now the translation looks like
<?xml version="1.1" encoding="UTF-8" ?>
<xsl:stylesheet xpath-default-namespace="records:2"
xmlns="reference-data:2"
xmlns:xsl="http://www.w3.org/1999/XSL/Transform"
xmlns:xsi="http://www.w3.org/2001/XMLSchema-instance"
xmlns:stroom="stroom"
xmlns:evt="event-logging:3"
version="2.0">
<!--
GEOHOST REFERENCE FEED:
CHANGE HISTORY
v1.0.0 - 2020-02-09 John Doe
This is a reference feed for device Logical and Geographic data.
The feed provides for each device
* the device FQDN
* the device IP Address
* the device Country location (using ISO 3166-1 alpha-3 codes)
* the device Site location
* the device Building location
* the device Room location
*the device TimeZone location (both standard then daylight timezone offsets from UTC)
The reference maps are
FQDN_TO_IP - Fully Qualified Domain Name to IP Address
IP_TO_FQDN - IP Address to FQDN (HostName)
FQDN_TO_LOC - Fully Qualified Domain Name to Location element
-->
<xsl:template match="records">
<referenceData xmlns="reference-data:2"
xsi:schemaLocation="reference-data:2 file://reference-data-v2.0.xsd" version="2.0.1">
<xsl:apply-templates/>
</referenceData>
</xsl:template>
<!-- MAIN TEMPLATE -->
<xsl:template match="record">
<!-- FQDN_TO_IP map -->
<reference>
<map>FQDN_TO_IP</map>
<key>
<xsl:value-of select="lower-case(data[@name='FQDN']/@value)" />
</key>
<value>
<IPAddress>
<xsl:value-of select="data[@name='IPAddress']/@value" />
</IPAddress>
</value>
</reference>
<!-- IP_TO_FQDN map -->
<reference>
<map>IP_TO_FQDN</map>
<key>
<xsl:value-of select="lower-case(data[@name='IPAddress']/@value)" />
</key>
<value>
<HostName>
<xsl:value-of select="data[@name='FQDN']/@value" />
</HostName>
</value>
</reference>
<!-- FQDN_TO_LOC map -->
<reference>
<map>FQDN_TO_LOC</map>
<key>
<xsl:value-of select="lower-case(data[@name='FQDN']/@value)" />
</key>
<value>
<!--
Note, when mapping to a XML node set, we make use of the Event namespace - i.e. evt:
defined on our stylesheet element. This is done, so that, when the node set is returned,
it is within the correct namespace.
-->
<evt:Location>
<evt:Country>
<xsl:value-of select="data[@name='Country']/@value" />
</evt:Country>
<evt:Site>
<xsl:value-of select="data[@name='Site']/@value" />
</evt:Site>
<evt:Building>
<xsl:value-of select="data[@name='Building']/@value" />
</evt:Building>
<evt:Room>
<xsl:value-of select="data[@name='Room']/@value" />
</evt:Room>
<evt:TimeZone>
<xsl:value-of select="data[@name='TimeZones']/@value" />
</evt:TimeZone>
</evt:Location>
</value>
</reference>
</xsl:template>
</xsl:stylesheet>
and our second ReferenceData element would now look like
We have completed the translation and have hence completed the development of our GeoHost-V1.0-REFERENCE reference feed.
At this point, the reference feed is set up to accept Raw Reference data, but it will not automatically process the raw data and hence it will not place reference data into the reference data store.
To have Stroom automatically process Raw Reference streams, you will need to enable Processors for this pipeline.
Enabling the Reference Feed Processors
We now create the pipeline Processors for this feed, so that the raw reference data will be transformed into Reference Data on ingest and save to Reference Data stores.
Open the reference feed pipeline by selecting the
 GeoHost-V1.0-REFERENCE
×
tab to raise the GeoHost-V1.0-REFERENCE pipeline.
Then select the Processors sub-tab to show
This configuration tab is divided into two panes.
The top pane shows the current enabled Processors and any recently processed streams and the bottom pane provides meta-data about each Processor or recently processed streams.
First, move the mouse to the Add Processor
 icon at the top left of the top pane.
Select by left clicking this icon to have displayed the Add Filter selection window
This selection window allows us to filter what set of data streams we want our Processor to process.
As our intent is to enable processing for all GeoHost-V1.0-REFERENCE streams, both already received and yet to be received, then our filtering criteria is just to process all Raw Reference for this feed, ignoring all other conditions.
To do this, first click on the Add Term
 icon to navigate to the desired feed name (GeoHost-V1.0-REFERENCE) object
and press
Ok
to make the selection.
Next, we select the required stream type.
To do this click on the Add Term
 icon again.
Click on the down arrow to change the Term selection from Feed to Type.
Click in the Value position on the highlighted line (it will be currently empty).
Once you have clicked here a drop-down box will appear as per
at which point, select the Stream Type of Raw Referenceand then press
Ok
.
At this we return to the Add Processor selection window to see that the Raw Reference stream type has been added.
Note the Processor has been added but it is in a disabled state.
We enable both pipeline processor and the processor filter
Note - if this is the first time you have set up pipeline processing on your Stroom instance you may need to check that the Stream Processor job is enabled on your Stroom instance.
To do this go to the Stroom main menu and select Monitoring>Jobs>
Check the status of the Stream Processor job and enable if required.
If you need to enable the job also ensure you enable the job on the individual nodes as well (go to the bottom window pane and select the enable box on the far right)
Returning to the
 GeoHost-V1.0-REFERENCE
×
tab, Processors sub-item, if everything is working on your Stroom instance you should now see that Raw Reference streams are being processed by your processor - the Streams count is incrementing and the Tracker% is incrementing (when the Tracker% is 100% then all streams you selected (Filtered for) have been processed)
Navigating back to the Data sub-item and clicking on the reference feed stream in the Stream Table we see
In the top pane, we see the Streams table as per normal, but in the Specific stream table we see that we have both a Raw Reference stream and its child Reference stream.
By clicking on and highlighting the Reference stream we see its content in the bottom pane.
The complete ReferenceData for this stream is
<?xml version="1.1" encoding="UTF-8"?>
<referenceData xmlns="reference-data:2" xmlns:xsi="http://www.w3.org/2001/XMLSchema-instance" xmlns:stroom="stroom" xmlns:evt="event-logging:3" xsi:schemaLocation="reference-data:2 file://reference-data-v2.0.xsd" version="2.0.1">
<reference>
<map>FQDN_TO_IP</map>
<key>stroomnode00.strmdev00.org</key>
<value>
<IPAddress>192.168.2.245</IPAddress>
</value>
</reference>
<reference>
<map>IP_TO_FQDN</map>
<key>192.168.2.245</key>
<value>
<HostName>stroomnode00.strmdev00.org</HostName>
</value>
</reference>
<reference>
<map>FQDN_TO_LOC</map>
<key>stroomnode00.strmdev00.org</key>
<value>
<evt:Location>
<evt:Country>GBR</evt:Country>
<evt:Site>Bristol-S00</evt:Site>
<evt:Building>GZero</evt:Building>
<evt:Room>R00</evt:Room>
<evt:TimeZone>+00:00/+01:00</evt:TimeZone>
</evt:Location>
</value>
</reference>
<reference>
<map>FQDN_TO_IP</map>
<key>stroomnode01.strmdev01.org</key>
<value>
<IPAddress>192.168.3.117</IPAddress>
</value>
</reference>
<reference>
<map>IP_TO_FQDN</map>
<key>192.168.3.117</key>
<value>
<HostName>stroomnode01.strmdev01.org</HostName>
</value>
</reference>
<reference>
<map>FQDN_TO_LOC</map>
<key>stroomnode01.strmdev01.org</key>
<value>
<evt:Location>
<evt:Country>AUS</evt:Country>
<evt:Site>Sydney-S04</evt:Site>
<evt:Building>R6</evt:Building>
<evt:Room>5-134</evt:Room>
<evt:TimeZone>+10:00/+11:00</evt:TimeZone>
</evt:Location>
</value>
</reference>
<reference>
<map>FQDN_TO_IP</map>
<key>host01.company4.org</key>
<value>
<IPAddress>192.168.4.220</IPAddress>
</value>
</reference>
<reference>
<map>IP_TO_FQDN</map>
<key>192.168.4.220</key>
<value>
<HostName>host01.company4.org</HostName>
</value>
</reference>
<reference>
<map>FQDN_TO_LOC</map>
<key>host01.company4.org</key>
<value>
<evt:Location>
<evt:Country>USA</evt:Country>
<evt:Site>LosAngeles-S19</evt:Site>
<evt:Building>ILM</evt:Building>
<evt:Room>C5-54-2</evt:Room>
<evt:TimeZone>-08:00/-07:00</evt:TimeZone>
</evt:Location>
</value>
</reference>
</referenceData>
<reference>
<map>FQDN_TO_IP</map>
<key>host32.strmdev01.org</key>
<value>
<IPAddress>192.168.8.151</IPAddress>
</value>
</reference>
<reference>
<map>IP_TO_FQDN</map>
<key>192.168.8.151</key>
<value>
<HostName>host32.strmdev01.org</HostName>
</value>
</reference>
<reference>
<map>FQDN_TO_LOC</map>
<key>host32.strmdev01.org</key>
<value>
<evt:Location>
<evt:Country>AUS</evt:Country>
<evt:Site>Sydney-S02</evt:Site>
<evt:Building>RC45</evt:Building>
<evt:Room>5-134</evt:Room>
<evt:TimeZone>+10:00/+11:00</evt:TimeZone>
</evt:Location>
</value>
</reference>
<reference>
<map>FQDN_TO_IP</map>
<key>host14.strmdev00.org</key>
<value>
<IPAddress>192.168.234.9</IPAddress>
</value>
</reference>
<reference>
<map>IP_TO_FQDN</map>
<key>192.168.234.9</key>
<value>
<HostName>host14.strmdev00.org</HostName>
</value>
</reference>
<reference>
<map>FQDN_TO_LOC</map>
<key>host14.strmdev00.org</key>
<value>
<evt:Location>
<evt:Country>GBR</evt:Country>
<evt:Site>Bristol-S22</evt:Site>
<evt:Building>CAMP2</evt:Building>
<evt:Room>Rm67</evt:Room>
<evt:TimeZone>+00:00/+01:00</evt:TimeZone>
</evt:Location>
</value>
</reference>
</referenceData>
If we go back to the reference feed itself (and click on the
 button on the far right of the top and middle panes), we now see both the Reference and Raw Reference streams in the Streams Table pane.
Selecting the Reference stream in the Stream Table will result in the Specific stream pane displaying the Raw Reference and its child Reference stream (highlighted) and the actual ReferenceData output in the Data pane at the bottom.
Selecting the Raw Reference stream in the Streams Table will result in the Specific stream pane displaying the Raw Reference and its child Reference stream as before, but with the Raw Reference stream highlighted and the actual Raw Reference input data displayed in the Data pane at the bottom.
The creation of the Raw Reference is now complete.
At this point you may wish to organise the resources you have created within the Explorer pane to a more appropriate location such as Reference/GeoHost.
Because Stroom Explorer is a flat structure you can move resources around to reorganise the content without any impact on directory paths, configurations etc.
Now you have created the new folder structure you can move the various GeoHost resources to this location.
Select all four resources by using the mouse right-click button while holding down the Shift key.
Then right click on the highlighted group to display the action menu
Select move and the Move Multiple Items window will display.
Navigate to the Reference/GeoHost folder to move the items to this destination.
The final structure is seen below
7 - Search
7.1 - Elasticsearch integration
How to integrate Stroom with Elastic Search
Introduction
Stroom v6.1 can pass data to Elasticsearch for indexing.
Indices created using this process (i.e. those containing a StreamId and EventId corresponding to a particular Stroom instance)
are searchable via a Stroom dashboard, much like a Stroom Lucene index.
This integration provides operators with the flexibility to utilise the additional capabilities of Elasticsearch,
(like clustering and replication) and expose indexed data for consumption by external analytic or processing tools.
This guide will take you through creating an Elasticsearch index, setting up an indexing pipeline, activating a stream processor and searching the indexed data in both Stroom and Elasticsearch.
Assumptions
- You have created an Elasticsearch cluster.
For test purposes, you can quickly create a single-node cluster using Docker by following the steps in the Elasticsearch Docs (external link).
- The Elasticsearch cluster is reachable via HTTP/S from all Stroom nodes participating in stream processing.
- Elasticsearch security is disabled.
- You have a feed containing
Event data.
Key differences
- Unlike with Solr indexing, Elasticsearch field mappings are managed outside of Stroom, usually via the REST API (external link).
- Aside from creating the mandatory
StreamId and EventId field mappings, explicitly defining mappings for other fields is optional.
It is however, considered good practice to define these mappings, to ensure each field’s data type is correctly parsed and represented.
For text fields, it also pays to ensure that the appropriate mapping parameters are used (external link),
in order to satisfy your search and analysis requirements - and meet system resource constraints.
- Unlike both Solr and Lucene indexing, it is not necessary to mark a field as
stored (i.e. storing its raw value in the inverted index).
This is because Elasticsearch stores the content of the original document in the _source field (external link),
which is retrieved when populating search results.
Provided the _source field is enabled (as it is by default), a field is treated as stored in Stroom and its value doesn’t need to be retrieved via an extraction pipeline.
Indexing data
Creating an index in Elasticsearch
The following cURL command creates an index named stroom_test in Elasticsearch cluster http://localhost:9200 consisting of the following fields:
StreamId (mandatory, must be of data type long)EventId (mandatory, must also be long)Name (text). Uses the default analyzer, which tokenizes the text for matching on terms.
fielddata is enabled, which allows for aggregating on these terms (external link).State (keyword). Supports exact matching.
The created index consists of 5 shards.
Note that the shard count cannot be changed after index creation, without a reindex.
See this guide (external link) on shard sizing.
After creating the index, you can add additional field mappings.
Note the limitations (external link) in doing so, particularly the fact that it will not cause existing documents to be re-indexed.
It is worthwhile to test index mappings on a subset of data before committing to indexing a large event feed, to ensure the resulting search experience meets your requirements.
Registering the index in Stroom
This step creates an Elasticsearch Index in the Stroom Tree and tells Stroom how to connect to your Elasticsearch cluster
and index. Note that this process needs to be repeated for each index you create.
Steps
- Right-click on the folder in the Explorer Tree where you wish to create the index
- Select
New / Elasticsearch Index
- Enter a valid name for the index. It is a good idea to choose one that reflects either the feed name being indexed, or if
indexing multiple feeds, the nature of data they represent.
- In the index tab that just opened:
- Select the
Settings tab
- Set the
Index to the name of the index in Elasticsearch (e.g. stroom_test from the previous example)
- Set the
Connection URLs to one or more Elasticsearch node URLs. If multiple, separate each URL with ,.
For example, a URL like http://data-0.elastic:9200,http://data-1.elastic:9200 will balance requests to two data nodes
within an Elasticsearch cluster. See this document for guidance on node roles.
- Click
Test Connection. If the connection succeeds, and the index is found, a dialog is shown indicating
the test was successful. Otherwise, an error message is displayed.
- If the test succeeded, click the save button in the top-left. The
Fields tab will now be populated with fields from
the Elasticsearch index.
Note
The field mappings list is only updated when index settings are changed, or a Stroom indexing or search task begins.
The refresh button in the Fields tab does not have any effect.
Setting index retention
As with Solr indexing, index document retention is determined by defining a Stroom query.
Setting a retention query is optional and by default, documents will be retained in an index indefinitely.
It is recommended for indices containing events spanning long periods of time, that Elasticsearch Index Lifecycle Management (external link)
be used instead. The capabilities provided, such as automatic rollover to warm or cold storage tiers, are well worth considering, especially in high-volume production clusters.
Considerations when implementing ILM
- It is recommended that data streams are used when
indexing data. These allow easier rollover and work well with ILM policies. A data stream is essentially a container for multiple date-based indices
and to a search client such as Stroom, appears and is searchable like a normal Elasticsearch index.
- Use of data streams requires that a
@timestamp field of type date be defined for each document (instead of say, EventTime).
- Implementing ILM policies requires careful capacity planning, including anticipating search and retention requirements.
Creating an indexing pipeline
As with Lucene and Solr indexing pipelines, indexing data using Elasticsearch uses a pipeline filter.
This filter accepts <record> elements and for each, sends a document to Elasticsearch for indexing.
Each <data> element contained within a <record> sets the document field name and value. You should ensure the name attribute
of each <data> element exactly matches the mapping property of the Elasticsearch index you created.
Steps
- Create a pipeline inheriting from the built-in
Indexing template.
- Modify the
xsltFilter pipeline stage to output the correct <records> XML (see the Quick-Start Guide.
- Delete the default
indexingFilter and in its place, create an ElasticIndexingFilter (see screenshot below).
- Review and set the following properties:
batchSize (default: 10,000). Number of documents to send in a single request to the Elasticsearch Bulk API (external link).
Should usually be set to 1,000 or more.
The higher the number, the more memory is required by both Stroom and Elasticsearch when sending or receiving the request.index (required). Set this to the target Elasticsearch index in the Stroom Explorer Tree.refreshAfterEachBatch (default: false). Refreshes the Elasticsearch index after each batch has finished processing.
This makes any documents ingested in the batch available for searching.
Unless search results are needed in near-real-time, it is recommended this be set to false and the index refresh interval be set to an appropriate value.
See this document (external link) for guidance on optimising indexing performance.
Creating and activating a stream processor
Follow the steps as in this guide.
Checking data has been indexed
Query Elasticsearch, checking the fields you expect are there, and of the correct data type:
The following query displays five results:
You can also get an exact document count, to ensure this matches the number of events you are expecting:
For more information, see the Elasticsearch Search API documentation (external link).
Reindexing data
By default, the original document values are stored in an Elasticsearch index and may be used later on to re-index data (such as when a change is made to field mappings).
This is done via the Reindex API (external link).
Provided these values have not changed, it would likely be more efficient to use this API to perform a re-index,
instead of processing data from scratch using a Stroom stream processor.
On the other hand, if the content of documents being output to Elasticsearch has changed, the Elasticsearch index will need to be re-created
and the stream re-processed. Examples of where this would be required include:
- A new field is added to the indexing filter, which previously didn’t exist. That field needs to be searchable for all historical
events.
- A field is renamed
- A field data type is changed
If a field is omitted from the indexing translation, there is no need for a re-index, unless you wish to reclaim the space
occupied by that field.
Reindexing using a pipeline processor
- Delete the index. While it is possible to delete by query (external link), it is more efficient to drop the index.
Additionally, deleting by query doesn’t actually remove data from disk, until segments are merged.
- Re-create the index (as shown earlier)
- Create a new pipeline processor to index the documents
Searching
Once indexed in Elasticsearch, you can search either using the Stroom Dashboard user interface, or directly against
the Elasticsearch cluster.
The advantage of using Stroom to search is that it allows access to the raw source data (i.e. it is not limited to what’s stored in the index).
It can also use extraction pipelines to enrich search results for export in a table.
Elasticsearch on the other hand, provides a rich Search REST API (external link)
with powerful aggregations that can be
used to generate reports and discover patterns and anomalies. It can also be readily queried using third-party tools.
Stroom
See the Dashboard page in the Quick-Start Guide.
Instead of selecting a Lucene index, set the target data source to the desired Elasticsearch index in the Stroom Explorer Tree.
Once the target data source has been set, the Dashboard can be used as with a Lucene or Solr index data source.
Elasticsearch
Elasticsearch queries can be performed directly against the cluster using the Search API (external link).
Alternatively, there are tools that make search and discovery easier and more intuitive, like Kibana (external link).
Security
It is important to note that Elasticsearch data is not encrypted at rest, unless this feature is enabled and the relevant licensing tier (external link) is purchased.
Therefore, appropriate measures should be taken to control access to Elasticsearch user data at the file level.
For production clusters, the Elasticsearch security guidelines (external link) should be followed, in order to control access and ensure requests are audited.
You might want to consider implementing role-based access control (external link)
to prevent unauthorised users of the native Elasticsearch API or tools like Kibana, from creating, modifying or deleting data within sensitive indices.
7.2 - Search API
Stroom v6 introduced an API that allows a user to perform queries against Stroom resources such as indices and statistics. This is a guide to show how to perform a Stroom Query directly from bash using Stroom v7.
-
Create an API Key for yourself, this will allow the API to authenticate as you and run the query with your privileges.
-
Create a Dashboard that extracts the data you are interested in. You should create a Query and Table.
-
Download the JSON for your Query.
Press the download icon in the Query Pane to generate a file containing the JSON.
Save the JSON to a file named query.json.
-
Use curl to send the query to Stroom.
-
The query response should be in a file named response.out.
-
Optional step: reformat the response to csv using jq.
7.3 - Solr integration
This document will show how to use Solr from within Stroom. A single Solr node will be used running in a docker container.
Assumptions
- You are familiar with Lucene indexing within Stroom
- You have some data to index
Points to note
- A Solr core is the home for exactly one Stroom index.
- Cores must initially be created in Solr.
- It is good practice to name your Solr core the same as your Stroom Index.
Method
-
Start a docker container for a single solr node.
-
Check your Solr node. Point your browser at http://yourSolrHost:8983
-
Create a core in Solr using the CLI.
-
Create a SolrIndex in Stroom
-
Update settings for your new Solr Index in Stroom then press “Test Connection”.
If successful then press Save.
Note the “Solr URL” field is a reference to the newly created Solr core.
-
Add some Index fields.
e.g.EventTime, UserId
-
Retention is different in Solr, you must specify an expression that matches data that can be deleted.
-
Your Solr Index can now be used as per a Stroom Lucene Index.
However, your Indexing pipeline must use a SolrIndexingFilter instead of an IndexingFilter.
8 - Event Post Processing
How to do further processing on Events.
8.1 - Event Forwarding
How to write processed events to the file system for use by other systems.
Introduction
In some situations, you will want to automatically extract stored Events in their XML format to forward to the file system.
This is achieved via a Pipeline with an appropriate XSLT translation that is used to decide what events are forwarded.
Once the Events have been chosen, the Pipeline would need to validate the Events (via a schemaFilter) and then the Events would be passed to an xmlWriter and then onto a file system writer (fileSystemOutputStreamProvider or RollingFileAppender).
Example Event Forwarding - Multiple destinations
In this example, we will create a pipeline that writes Events to the file system, but to multiple destinations based on the location of the Event Client element.
We will use the EventSource/Client/Location/Country element to decided where to store the events.
Specifically, we store events from clients in AUS in one location, and events from clients in GBR to another.
All other client locations will be ignored.
Create translations
First, we will create two translations - one for each country location Australia (AUS) and Great Britain (GBR).
The AUS selection translation is
<?xml version="1.0" encoding="UTF-8" ?>
<xsl:stylesheet
version="3.0"
xmlns:xsl="http://www.w3.org/1999/XSL/Transform"
xmlns="event-logging:3"
xmlns:stroom="stroom"
xpath-default-namespace="event-logging:3
xmlns:xsi="http://www.w3.org/2001/XMLSchema-instance"
xmlns:xs="http://www.w3.org/2001/XMLSchema">
<!--
ClientAUS Translation: CHANGE HISTORY
v1.0.0 - 2015-01-19
v1.5.0 - 2020-04-15
This translation find all events where the EventSource/Client/Location/Country element
contains the string 'AUS' and then copies them.
-->
<!-- Match all events -->
<xsl:template match="/Events|/Events/@*">
<xsl:copy>
<xsl:apply-templates select="node()|@*" />
</xsl:copy>
</xsl:template>
<!-- Find all events whose Client location is in the AUS -->
<xsl:template match="Event">
<xsl:apply-templates select="EventSource/Client/Location/Country[contains(upper-case(text()), 'AUS')]" />
</xsl:template>
<!-- Country template - deep copy the event -->
<xsl:template match="Country">
<xsl:copy-of select="ancestor::Event" />
</xsl:template>
</xsl:stylesheet>
The Great Britain selection translation is
<?xml version="1.0" encoding="UTF-8" ?>
<xsl:stylesheet
version="3.0"
xmlns:xsl="http://www.w3.org/1999/XSL/Transform"
xmlns="event-logging:3"
xmlns:stroom="stroom"
xpath-default-namespace="event-logging:3
xmlns:xsi="http://www.w3.org/2001/XMLSchema-instance"
xmlns:xs="http://www.w3.org/2001/XMLSchema">
<!--
ClientGBR Translation: CHANGE HISTORY
v1.0.0 - 2015-01-19
v1.5.0 - 2020-04-15
This translation find all events where the EventSource/Client/Location/Country
element contains the string 'GBR' and then copies them.
-->
<!-- Match all events -->
<xsl:template match="/Events|/Events/@*">
<xsl:copy>
<xsl:apply-templates select="node()|@*" />
</xsl:copy>
</xsl:template>
<!-- Find all events whose Client location is in the GBR -->
<xsl:template match="Event">
<xsl:apply-templates select="EventSource/Client/Location/Country[contains(upper-case(text()), 'GBR')]" />
</xsl:template>
<!-- Country template - deep copy the event -->
<xsl:template match="Country">
<xsl:copy-of select="ancestor::Event" />
</xsl:template>
</xsl:stylesheet>
We will store this capability in the Explorer Folder MultiGeoForwarding.
Create two new XSLT under this folder, one called ClientAUS and one called ClientGBR.
Copy and paste the relevant XSL from the above code blocks into its comparable XSLT windows.
Save the XSLT by clicking on the save
 icon.
Having created the two translations we see
Create Pipeline
We now create a Pipeline called MultiGeoFwd in the Explorer tree.
Within the MultiGeoForwarding folder right click to bring up the object context menu and sub-menu then create a New
Pipeline called MultiGeoFwd.
The Explorer should now look like
Clicking on the Pipeline Settings sub-item and add an appropriate description
Now switch to the Structure sub-item and select the
 Source
element.
Next click on the Add New Pipeline Element icon
 .
.
Select Parser, XMLParser from the Element context menu
Click on OK in the Create Element dialog box to accept the default for the parser Id.
We continue building the pipeline structure by sequentially selecting the last Element and adding the next required Element.
We next add a SplitFilter Element
We change the SplitFilter Id: from splitFilter to multiGeoSplitFilter and click on OK to add the Element to the Pipeline
Our Pipeline currently looks like
We now add the two XSLT translation elements, ClientAUS and ClientGBR to the split Filter.
Left click on the split Filter then left click on the Add New Pipeline Element to bring up the pipeline Element context menu and select the XSLTFilter item
and change the Id: from xsltFilter to ClientAUSxsltFilter
Now select the multiGeoSplitFilter Element again and add another XSLTFilter as previously
Name this xsltFilter ClientGBRxsltFilter.
At this stage the Pipeline should look like
To continue building the Pipeline Structure, left click the
 ClientAUSxlstFilter
ClientAUSxsltFilter element then left click on the Add New Pipeline Element
 to bring up the pipeline Element context menu and select the SchemaFilter item.
and change the Id: from schemaFilter to AUSschemaFilter to show
Now, left click the AUSschemaFilter element then then right click on the Add New Pipeline Element
 to bring up the pipeline Element context menu and select the XMLWriter item
and change the Id: from xmlWriter to AUSxmlWriter
Your Pipeline should now look like
Finally, left click the AUSxmlWriter element then then right click on the Add New Pipeline Element Add New Pipeline Element
 to bring up the Destination pipeline Element context menu.
Select RollingFileAppender
and change the Id: from rollingFileAppender to AUSrollingFileAppender to show
This completes the pipeline structure for the AUS branch of the pipeline. Replicate the process of adding schemaFilter, xmlWriter, and rollingFileAppender Elements for the GBR branch of the pipeline to get the complete pipeline structure as below
Save your Pipeline development work by clicking on the
 icon at the top left of the MultiGeoFwd pipeline tab.
We will now assign appropriate properties to each of the pipeline’s elements.
First, the client xsltFilters.
Click the ClientAUSxsltFilter element to show
In the middle pane click on the xslt Property Name line.
Now click on the Edit Property
 icon
icon
This will bring up the Edit Property selection window
Select the Value: to be the ClientAUS translation.
Click on OK twice to get your back to main MultiGeoFwd tab which should now have an updated middle pane that looks like
Now go back to the top pane of the Pipeline Structure and select the AUSschemaFilter element on the pipeline.
Then click the schemaGroup Property Name line.
Now click on the Edit Property
 icon.
Set the Property Value to be EVENTS.
then press OK.
Now select the AUSxmlWriter element in the pipeline structure and click the indentOutput Property Name line.
Click on the Edit Property
 icon.
Set the Property Value to be true.
The completed Element should look like
Next, select the
 AUSrollingFileAppender
and change the Properties as per
- fileName to be
fwd_${ms}.lock
- frequency to be
15m
- outputPaths to be
/stroom/volumes/defaultStreamVolume/forwarding/AUS00
- rolledFileName to be
fwd_${ms}.ready
Note that these settings are for demonstration purposes only and will depend on your unique Stroom instance’s configuration.
The outputPath can contain replacement variables to provide more structure if desired, see File Output substitution variables.
Repeat this Element Property Name assignment for the GBR branch of the pipeline substituting the ClientGBR translation and /stroom/volumes/defaultStreamVolume/forwarding/GBR00 for rollingFileAppender outputPaths where appropriate.
Note, if you expect lots of events to be processed by the pipeline, you may which to create multiple outputPaths.
For example, you could have
/stroom/volumes/defaultStreamVolume/forwarding/_AUS00_,
/stroom/volumes/defaultStreamVolume/forwarding/_AUS01_,
/stroom/volumes/defaultStreamVolume/forwarding/_AUS0n_
and
/stroom/volumes/defaultStreamVolume/forwarding/_GBR00_,
/stroom/volumes/defaultStreamVolume/forwarding/_GBR01_,
/stroom/volumes/defaultStreamVolume/forwarding/_GBR0n_
as appropriate.
Save the pipeline by pressing the Save
 icon.
icon.
Test Pipeline
We first select a stream of Events which we know to have both AUS and GBR Client locations.
We have such a stream from our Apache-SSLBlackBox-V2.0-EVENTS Feed.
We select the Events stream and Enter Stepping Mode by pressing the large
 button in the bottom right.
and we will choose the
 MultiGeoFwd to step with.
We are now presented with the Stepping tab positioned at the start
If we step forward by clicking on the
 icon we will see that our first event in our source stream has a Client Country location of USA.
If we now click on the
 ClientAUSxsltFilter
element we will see the ClientAUS translation in the code pane.
The first Event in the input pane and an empty event in the output pane.
The output is empty as the Client/Location/Country is NOT the string AUS, which is what the translation is matching on.
If we step forward to the 5th Event we will see the output pane change and become populated.
This is because this Event’s Client/Location/Country value is the string AUS.
Note, that you can move to the 5th Event on the pipeline by clicking on the
 icon repeatedly until you get to the 5th event, or you can insert your cursor into the recordNo of the stepping key to manually change the recordNo from 1 to 5
and then press
Enter.
This jumps the stepping process to the RecordNo you specify, in this particular case “5”.
If you repeatedly click on the
 icon seven more times you will continue to see Events in the output pane, as our stream source Client/Location/Country value is AUS for Events 5-11.
Now, double click on the
 ClientGBRxsltFilter
element.
The output pane will once again be empty as the Client/Location/Country value of this Event (AUS) does not match what your translation is filtering on (GBR).
If you now step forward one event using the
 icon, you will see the ClientGBR translation output pane populate as Events 12-16 have a Client/Location/Country of GRC.
We have thus tested the ‘splitting’ effect of our pipeline.
We now need to turn it on and produce files.
Enabling Processors for Multi Forwarding Pipeline
To enable the Processors for the pipeline, select the MultiGeoFwd pipeline tab and then select the Processors sub-item.
For testing purposes, we will only apply this pipeline to our Apache-SSLBlackBox-V2.0-EVENTS feed to minimise the test output files.
To create the Processor, click the Add Processor
 icon to bring up the Add Processor selection window.
Add the following items to the processor:
- Feed is
Apache-SSLBlackBox-V2.0-EVENTS
- Type =
Events
then press OK to see
Enable the processors by checking both Enabled check boxes
If we switch to the Active Tasks tab of the MultiGeoFwd pipeline, a refresh of the panes
 will show that we have passed streams from the
APACHE-SSLBlackBox-V2.0-EVENTS feed to completion.
If we select the MultiGeoFwd pipeline in the top pane we will see each stream that has run.
Take note that all streams have processed on Node node1a.
Examine Output Files on Destination Node
If we navigate to the /stroom/volumes/defaultStreamVolume/forwarding directory on the processing node we should be able to view the expected output files.
The output directory contains files with suffixes of *.lock or *.ready.
All the files that are ‘currently processing’ have a nomenclature of *.lock suffix.
These are the files that our pipeline is currently writing to.
Remember we configured the rollingFileAppender to roll the files at a frequency of 15 minutes.
We may need to wait up to 15 minutes before a file move from .lock to .ready status.
If we check one of the AUS00 output files we see the expected result
Similarly, if we look at one of the GBR00 output files we also see the expected output
At this point, you can manage the .ready files in any manner you see fit.
 Apache-SSLBlackBox-V2.0-EVENTS Pipeline
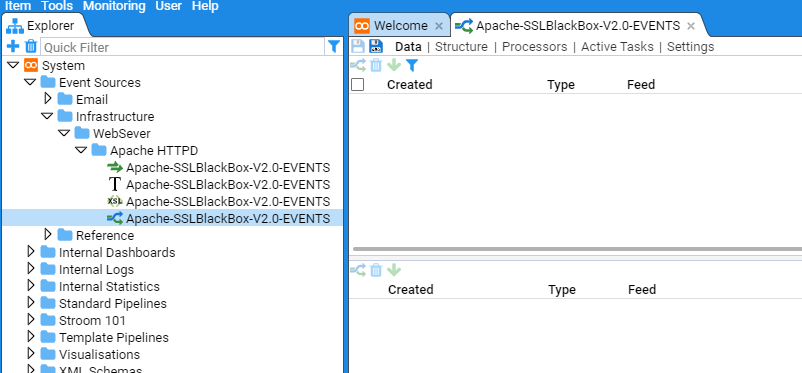

 icon at the top left of the top pane.
Select by left clicking this icon to display the Add Filter selection window
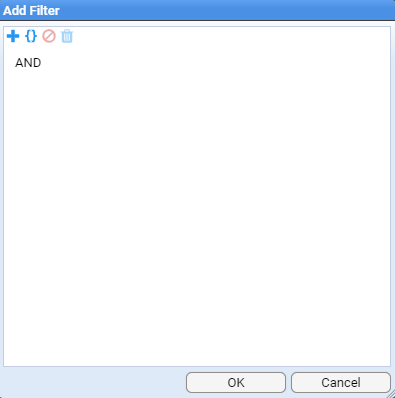
 icon to navigate to the desired feed name (Apache-SSLBlackBox-V2.0-EVENT) object
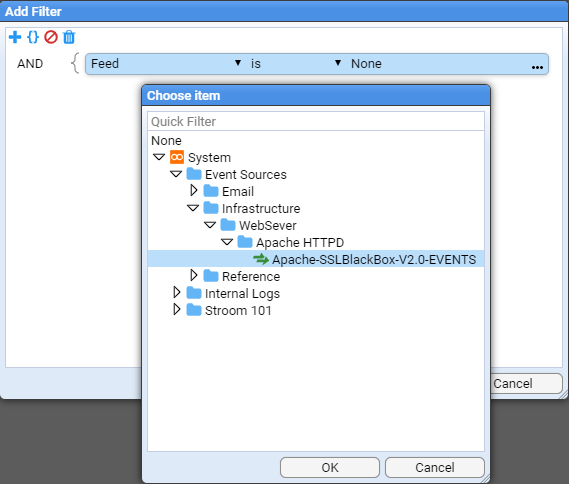
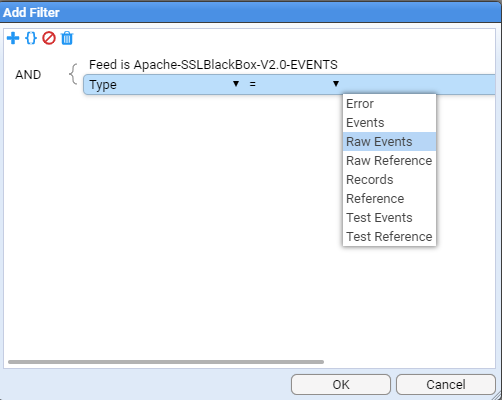


 button at the top of the right of the top pane, you will see that the Child processor has processed a stream, listing the time it did it and also listing the last time the processor looked for more streams to process and how many it found.
If your event feed contained multiple streams you would see the streams count incrementing and the Tracker% incrementing (when the Tracker% reaches 100% then all current streams you filtered for have been processed).
You may need to click on the refresh

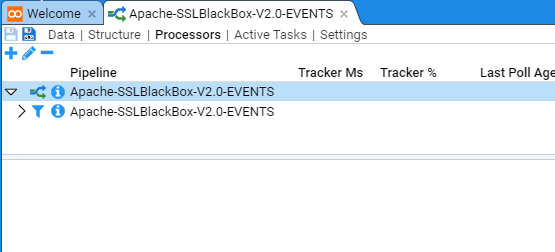
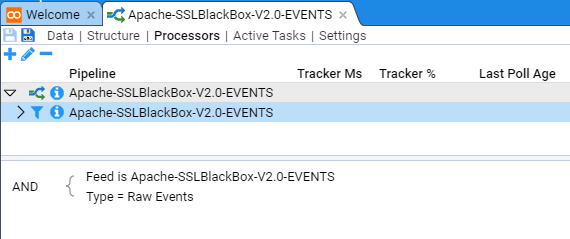


 icon at the top left of a pane.
This will reveal additional information such as
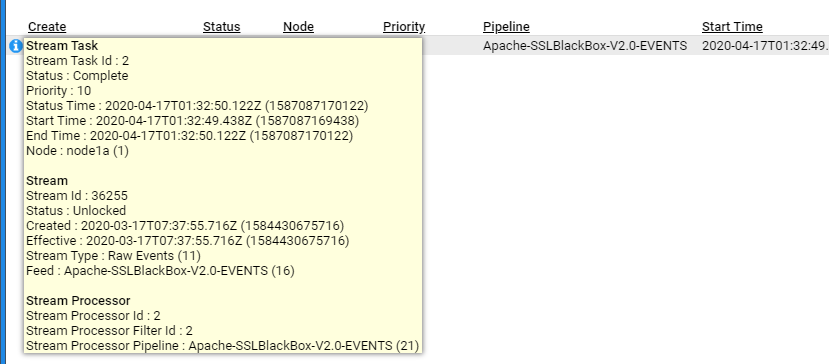
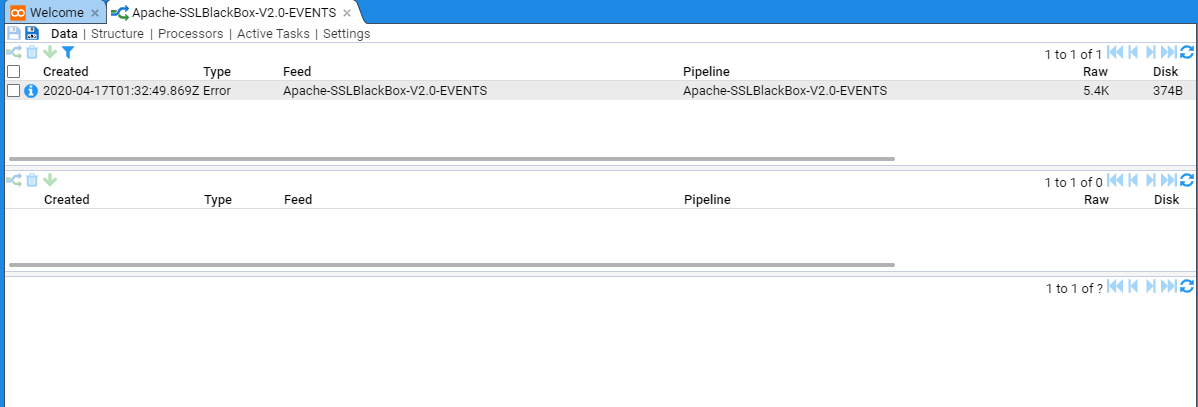
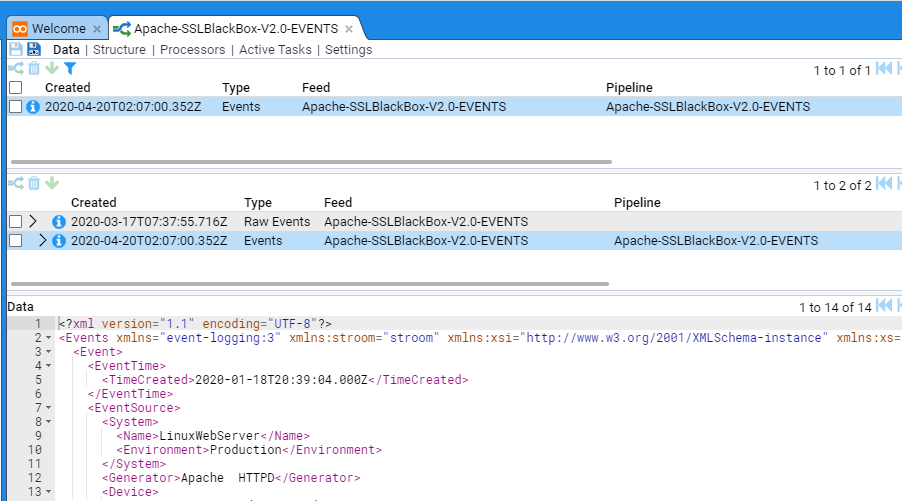
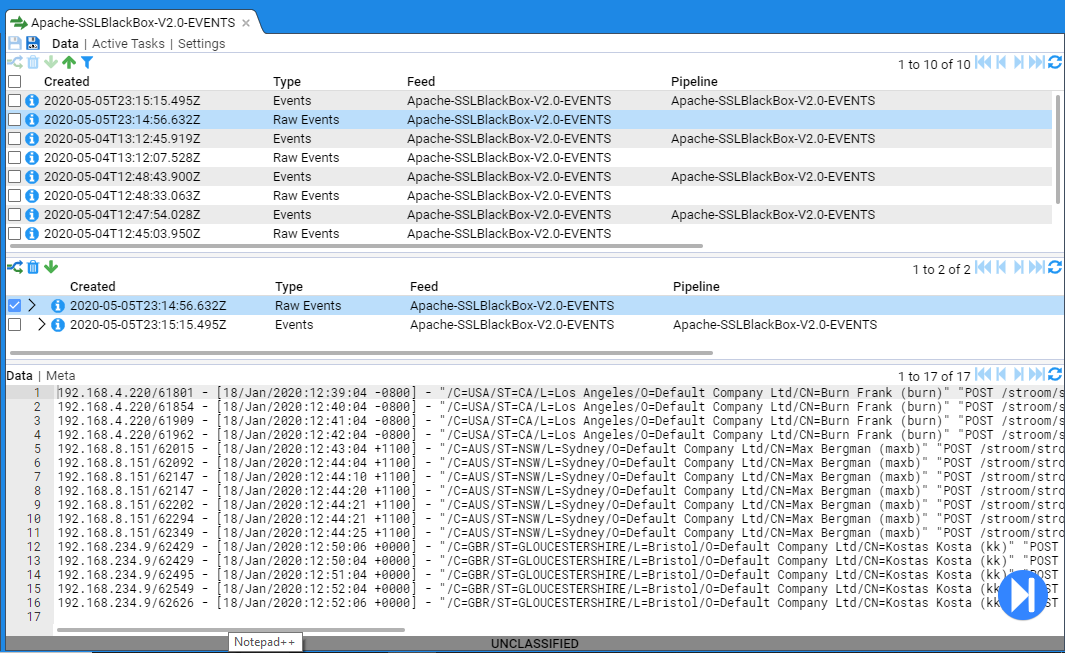
 icon in the top left of the same pane.
This will cause the pipeline to reprocess the selected stream.
One can only reprocess Event or Error streams.
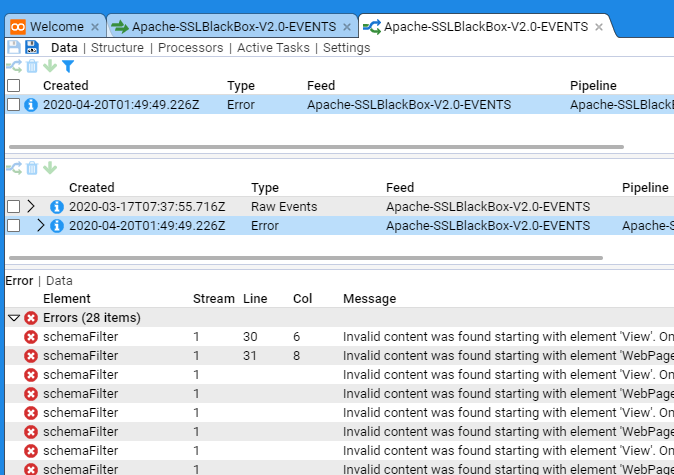
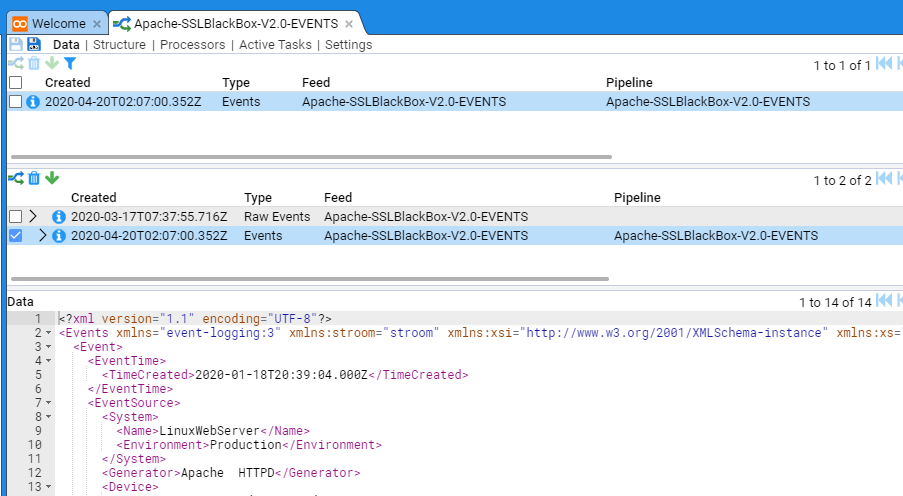
 icon.
icon.
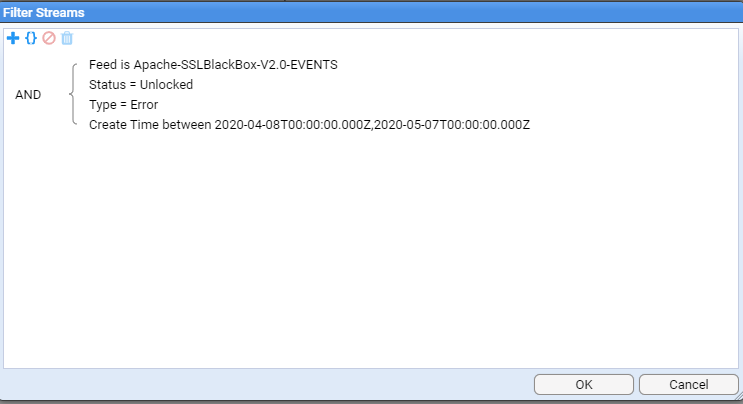
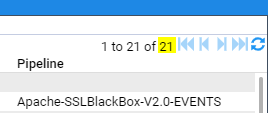
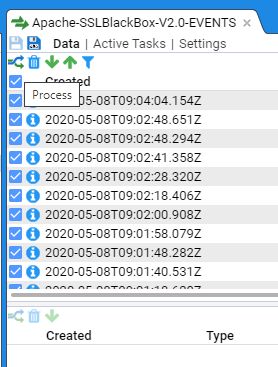
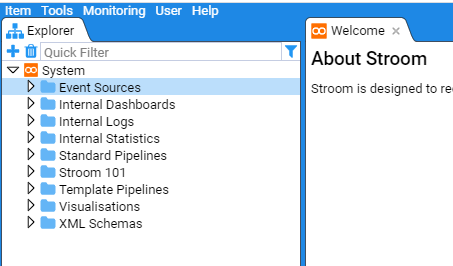
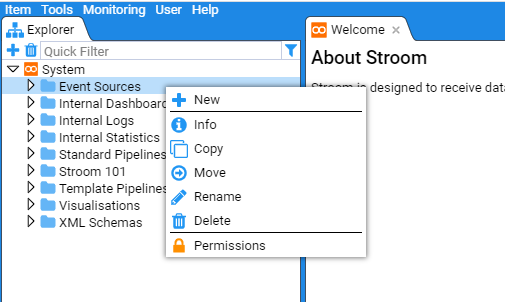
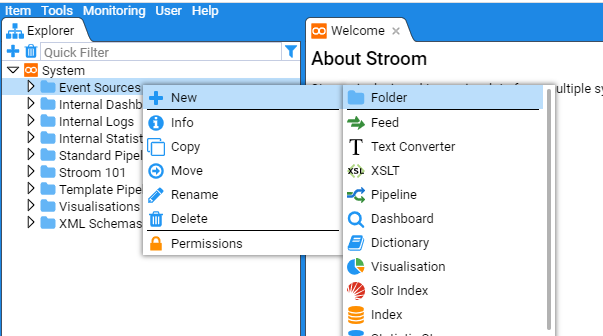
 icon, at which point the New Folder selection window will be presented
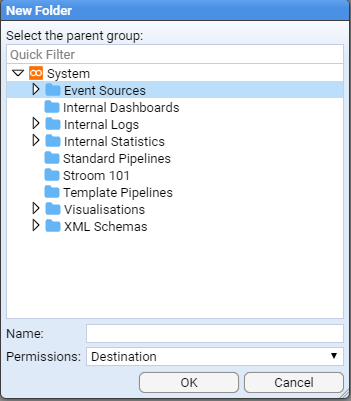
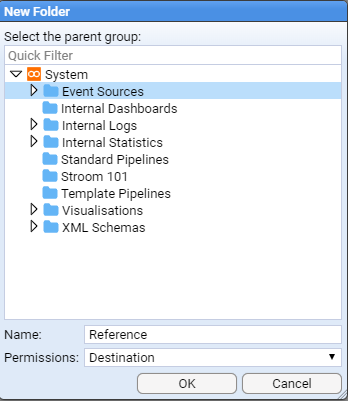
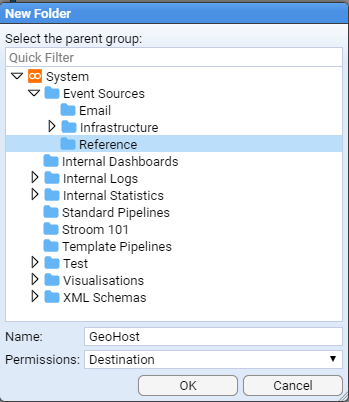

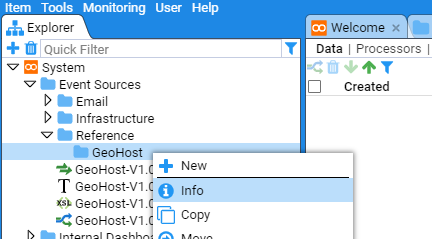
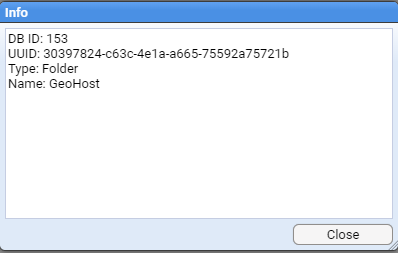
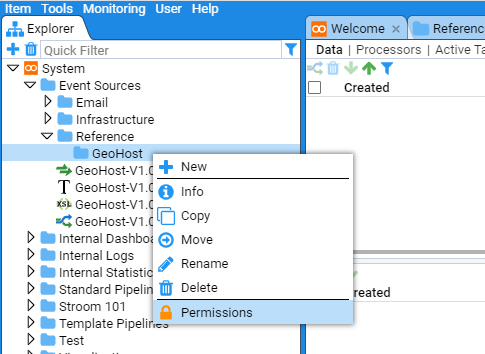
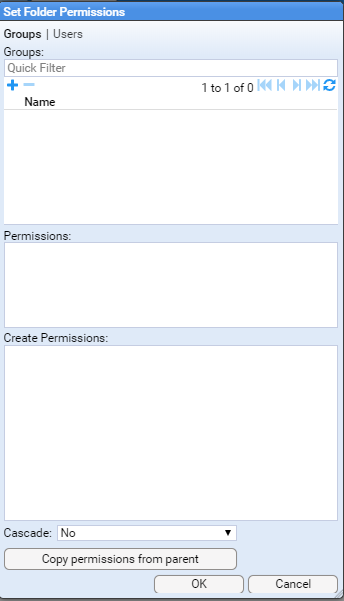
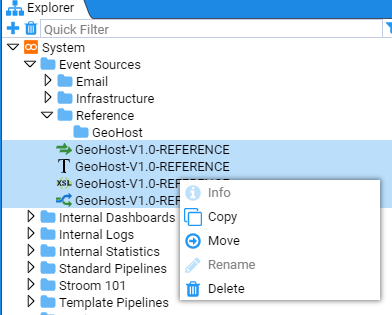
 and the Move Multiple Items window will display.
Navigate to the
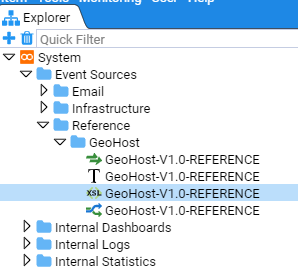
 or down
 indicates whether or not the folder is expanded.

 Feed.
Feed.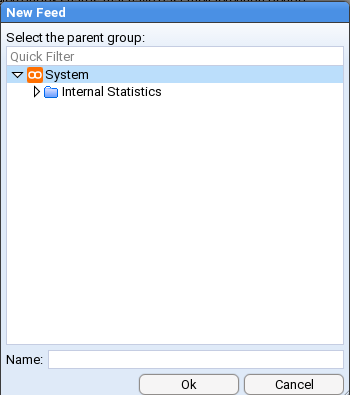
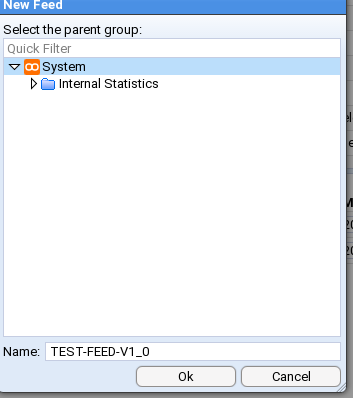
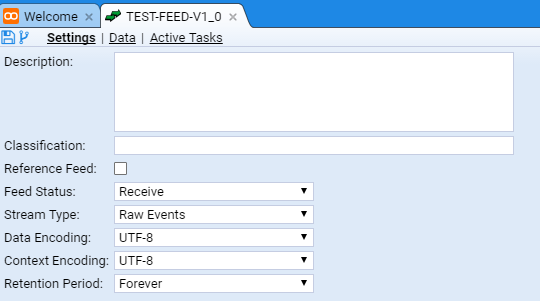
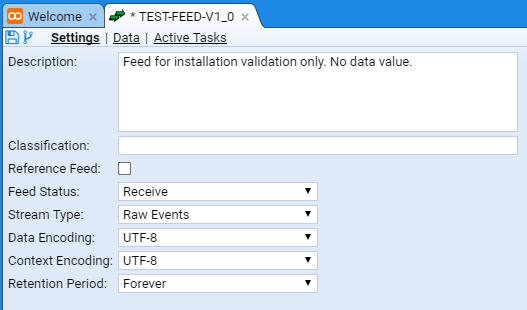
 in the top left of the
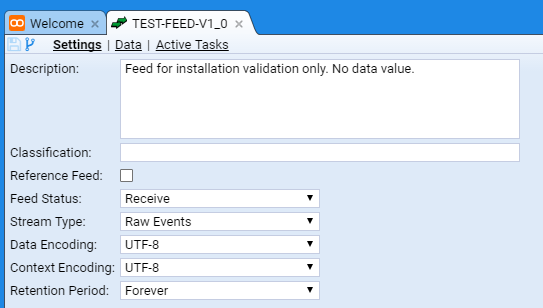
 in the
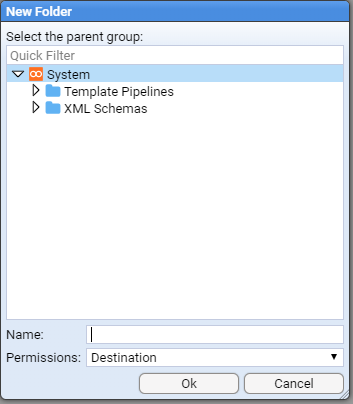
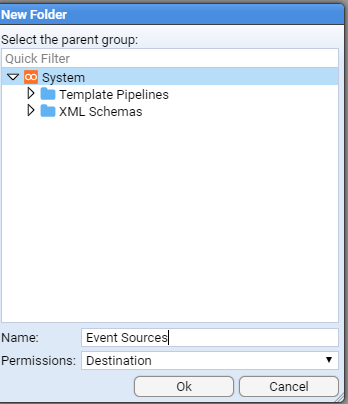


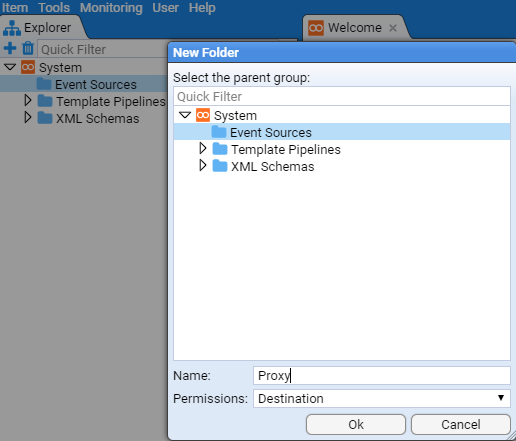


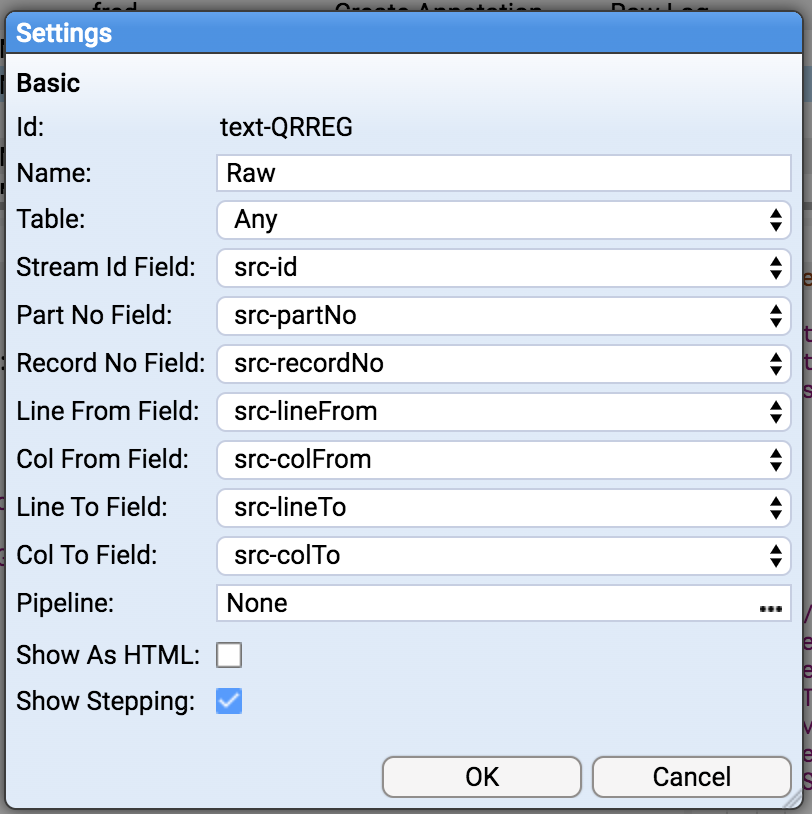
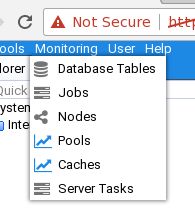
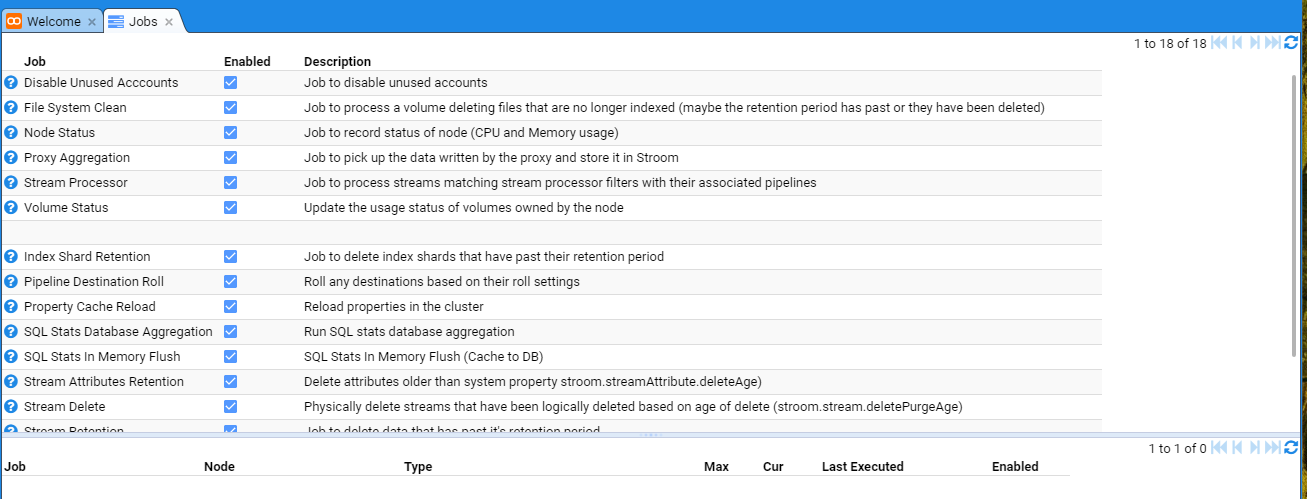
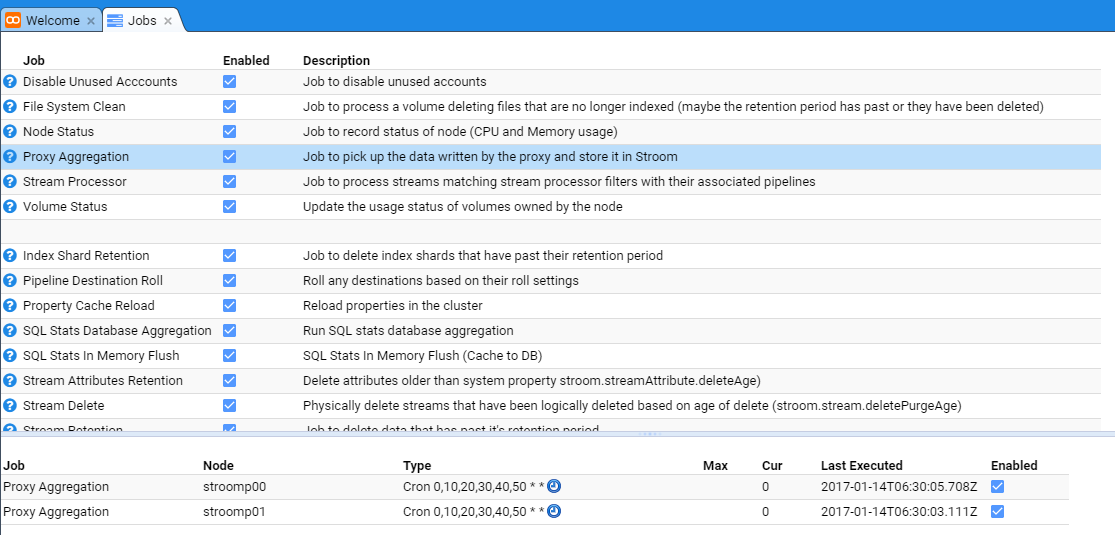
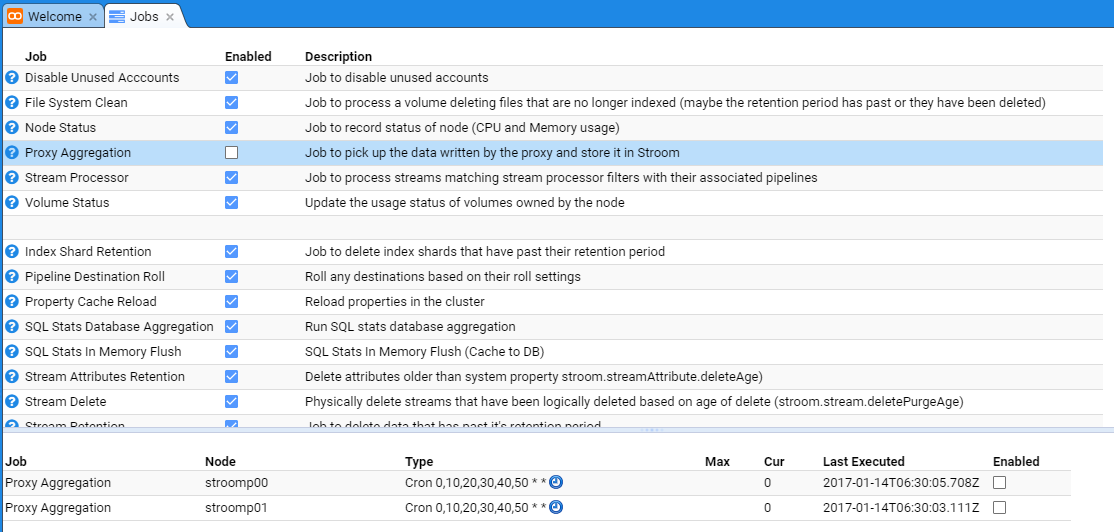
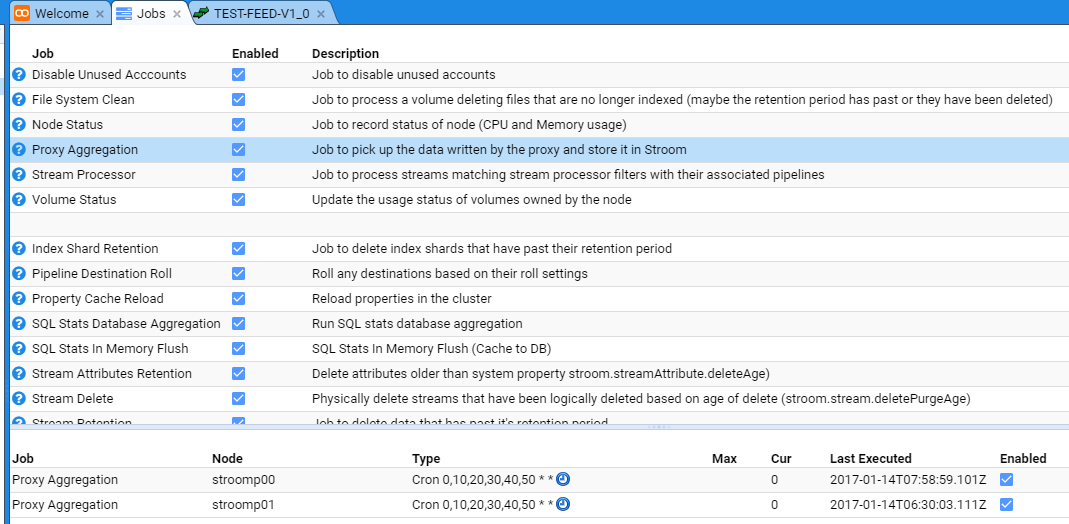

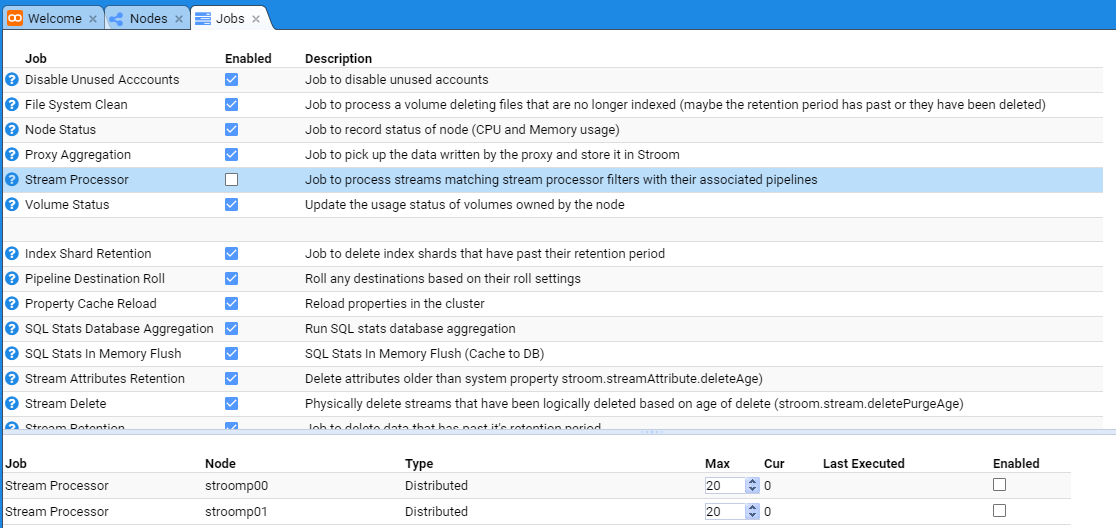
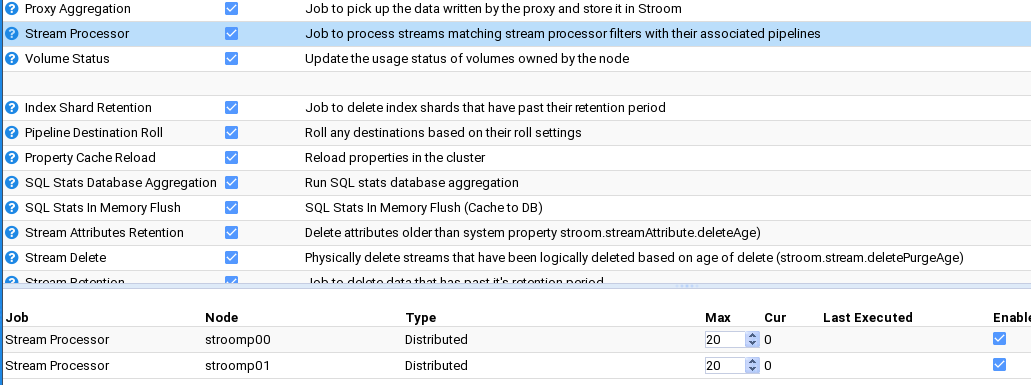
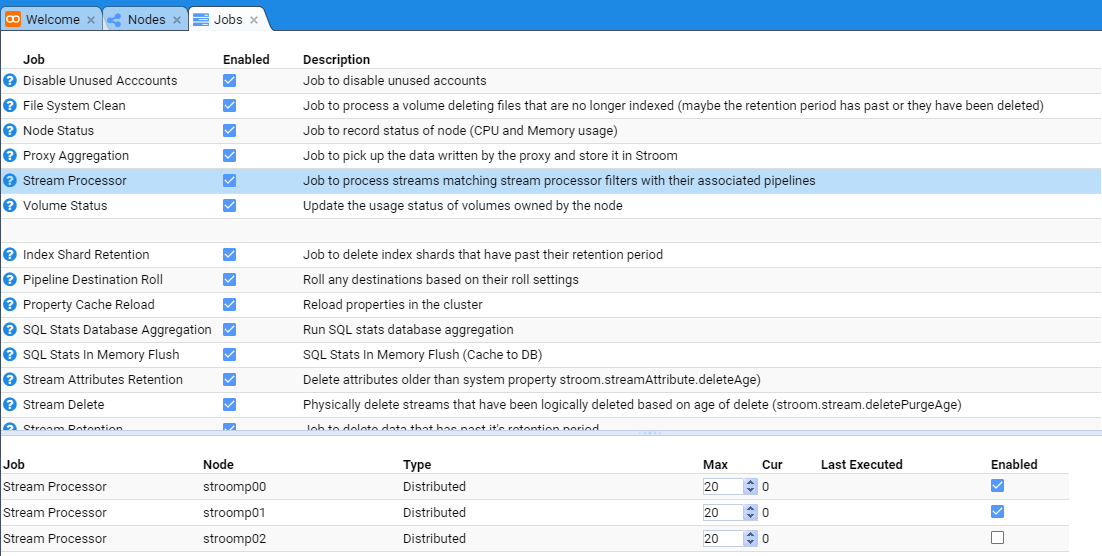
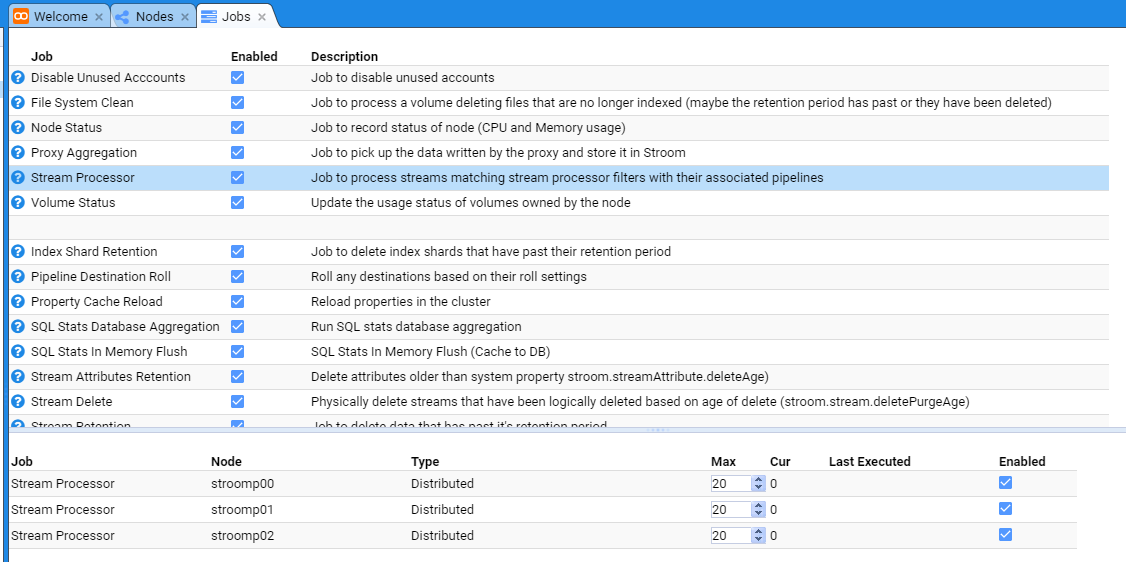
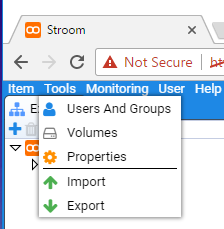
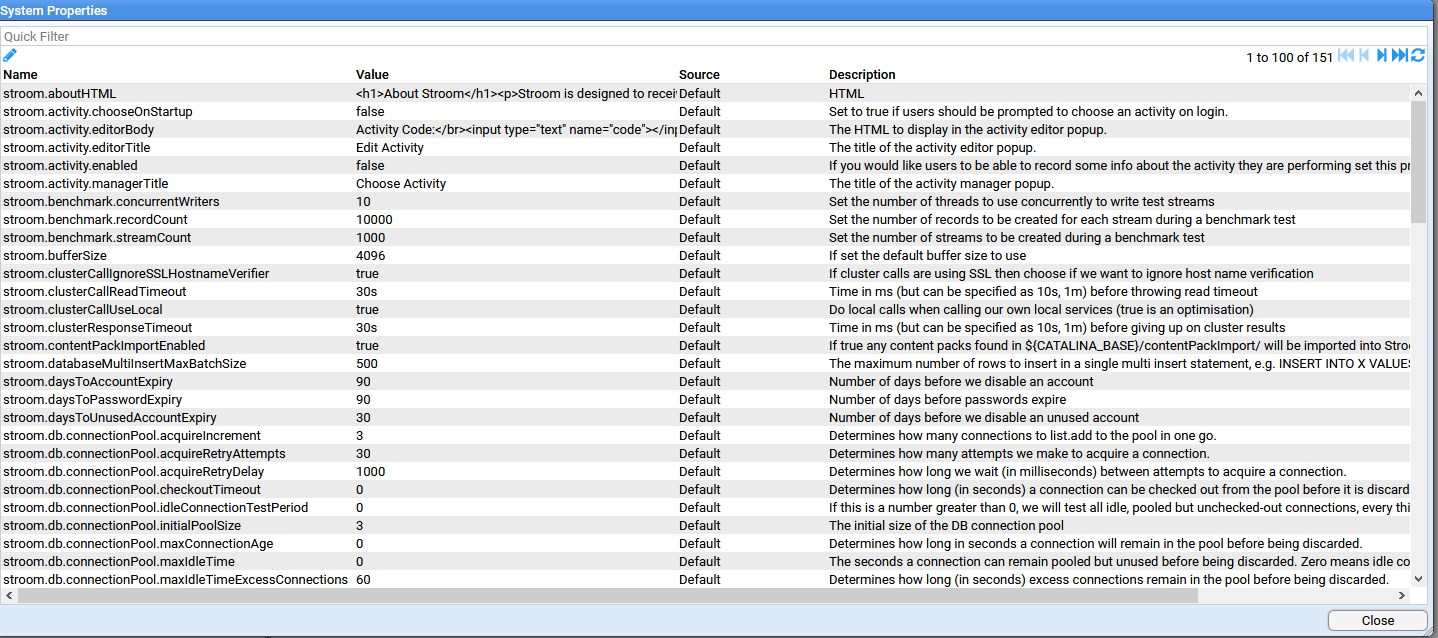

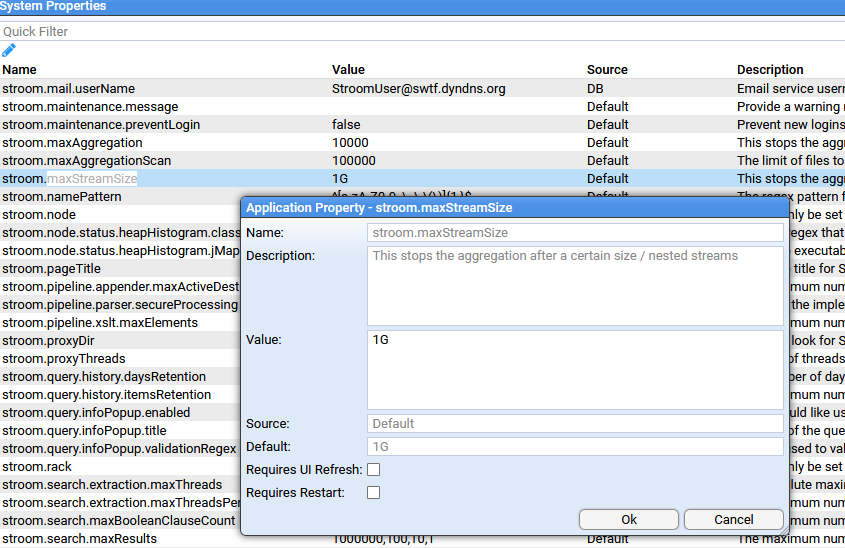
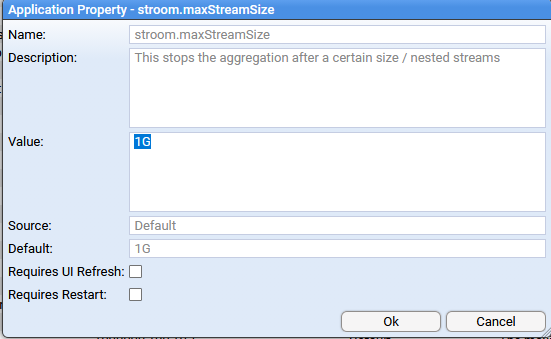
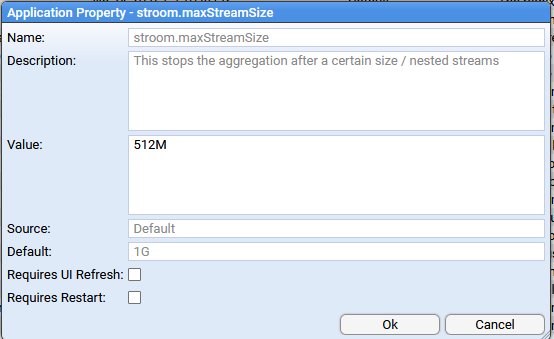


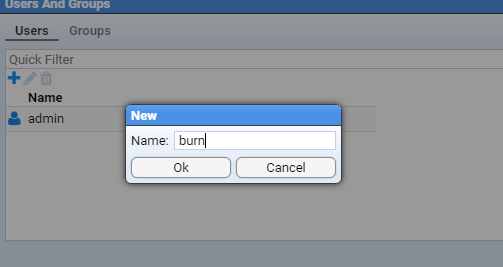
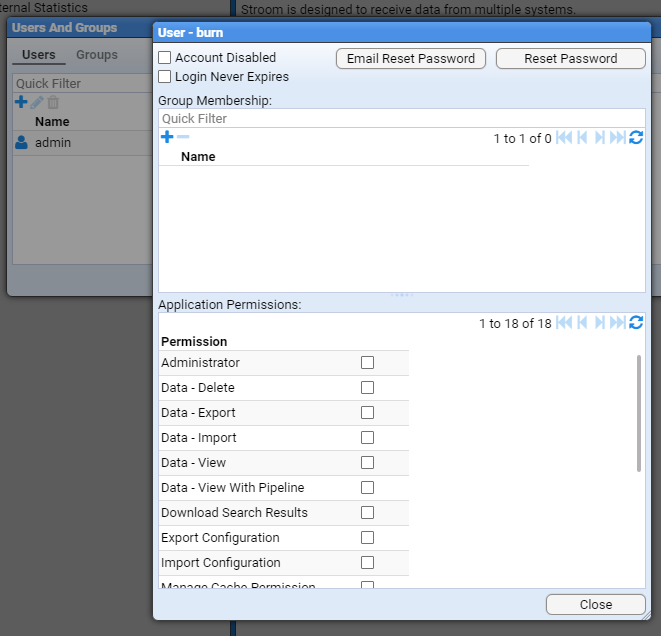

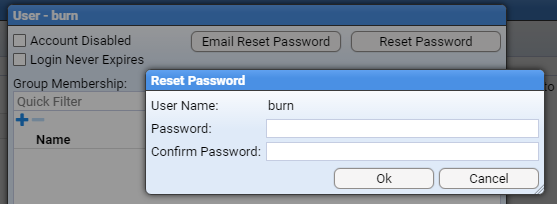

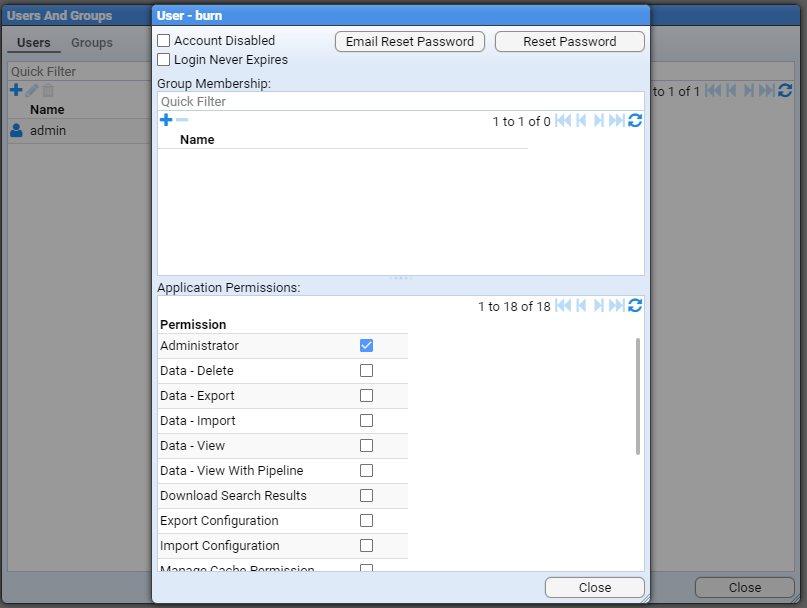

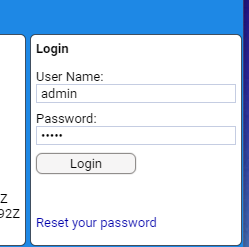

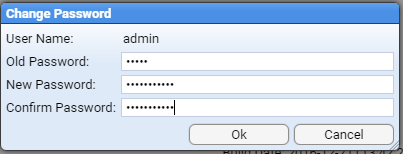
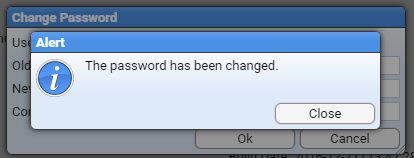

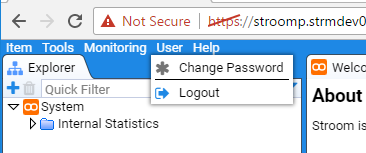




 in the top left of
the


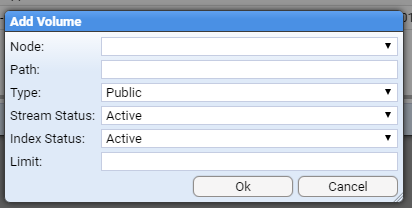
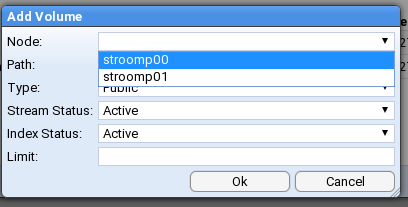
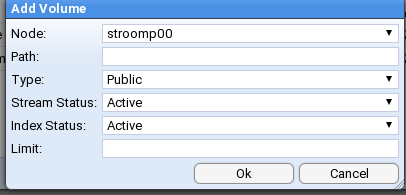
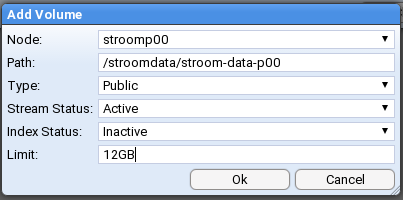

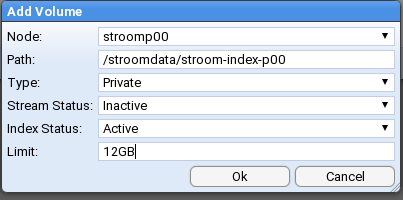


 in the top left of the


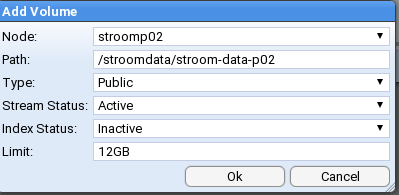


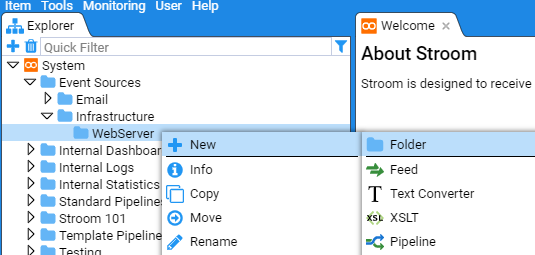
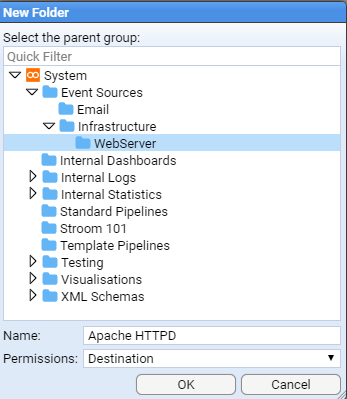
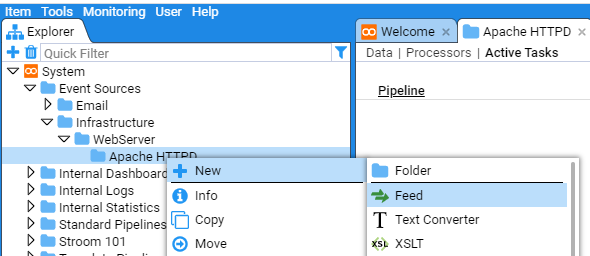
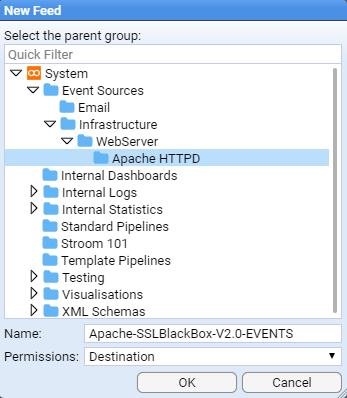
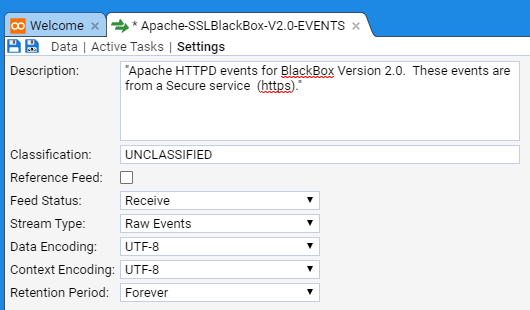
 Text Converter


 XSLT
XSLT


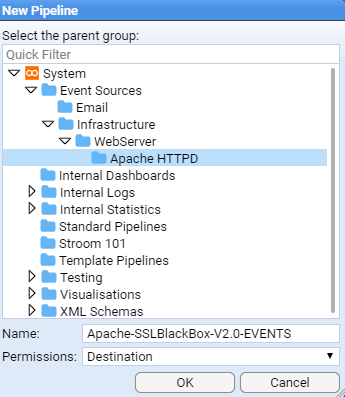

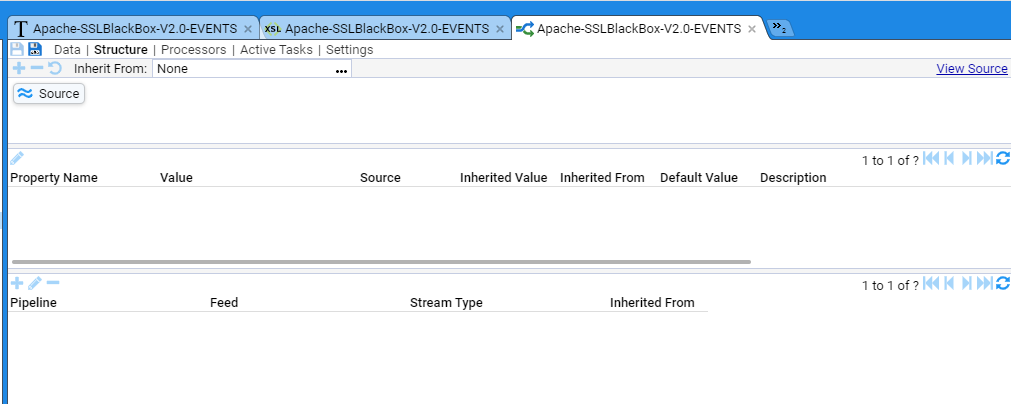

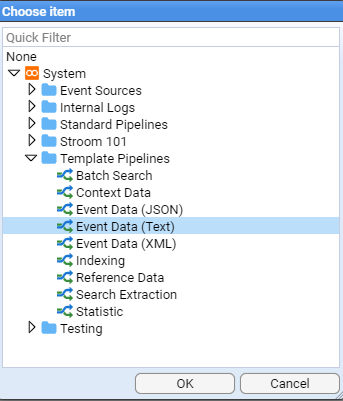

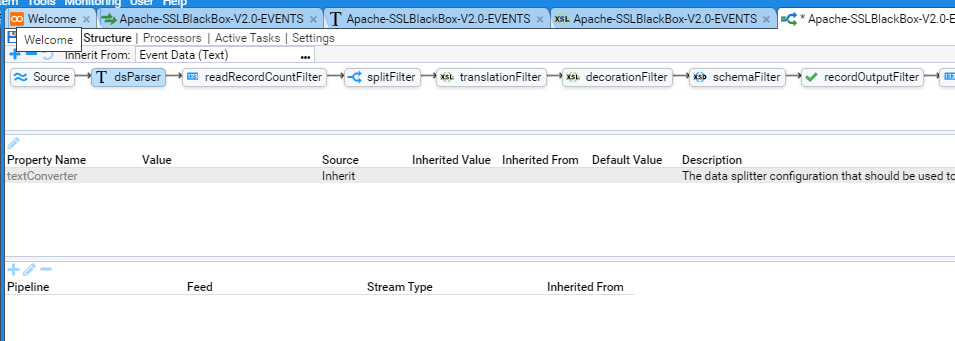
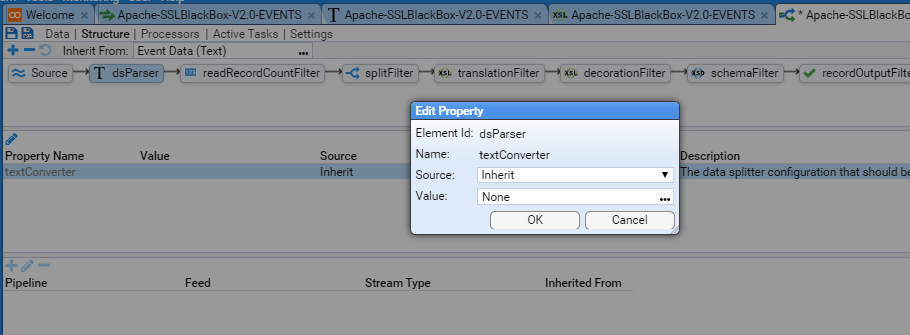
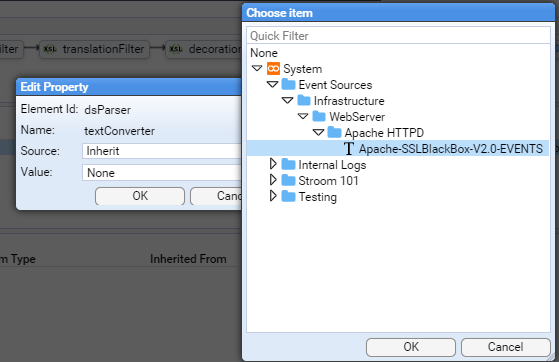
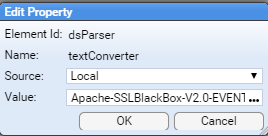

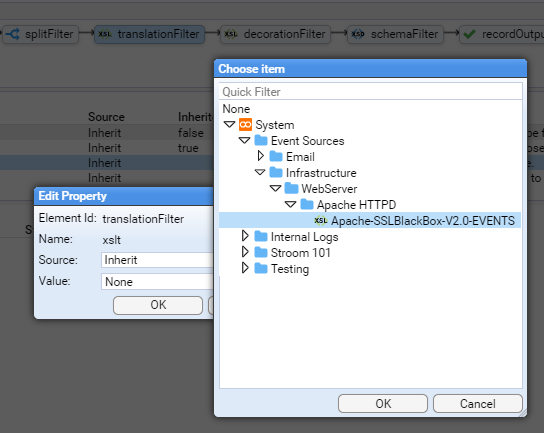
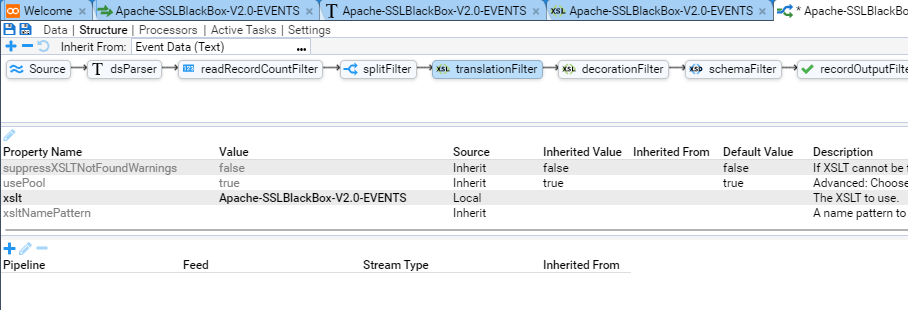


 in the top left of the Stream table pane.
On clicking the Upload icon, we are presented with the data Upload selection window.

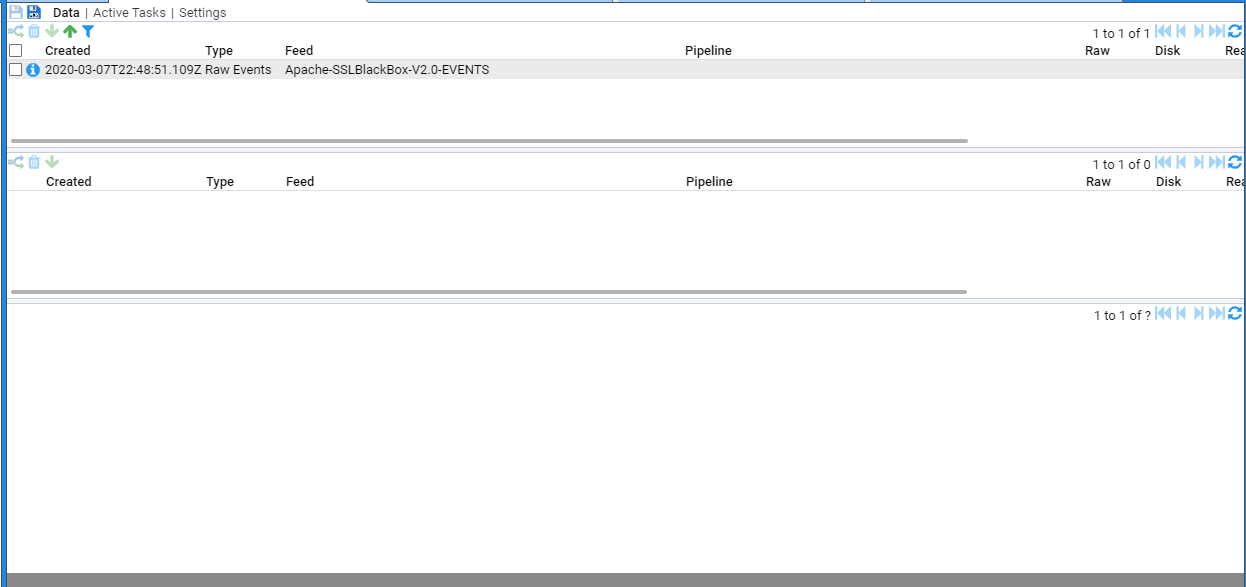
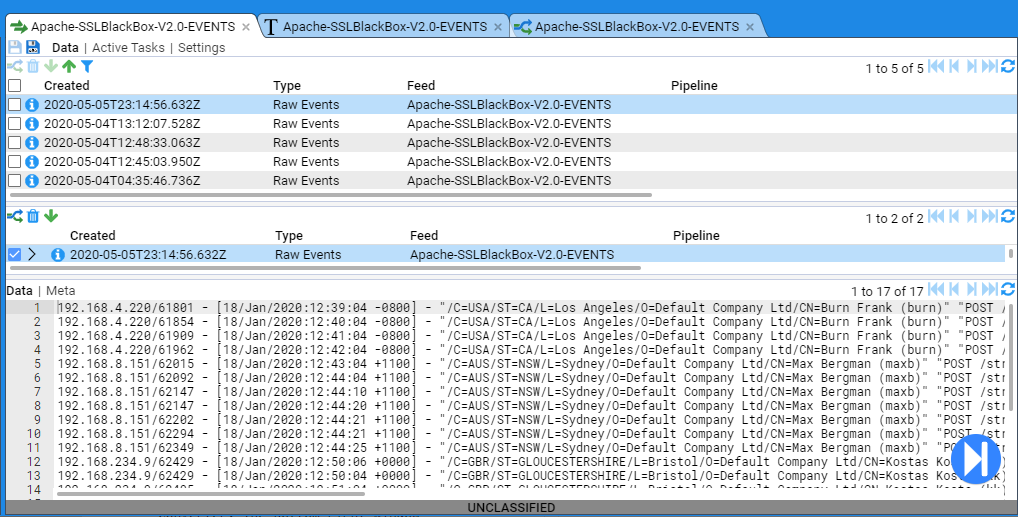

 ) are now enabled.
 found at the bottom right corner of the Data/Meta-data pane.
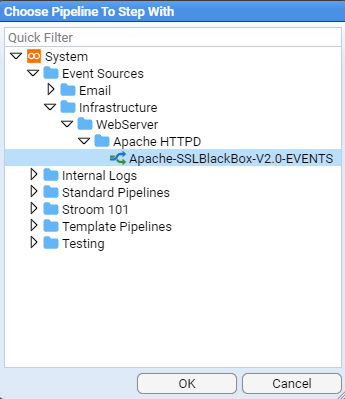

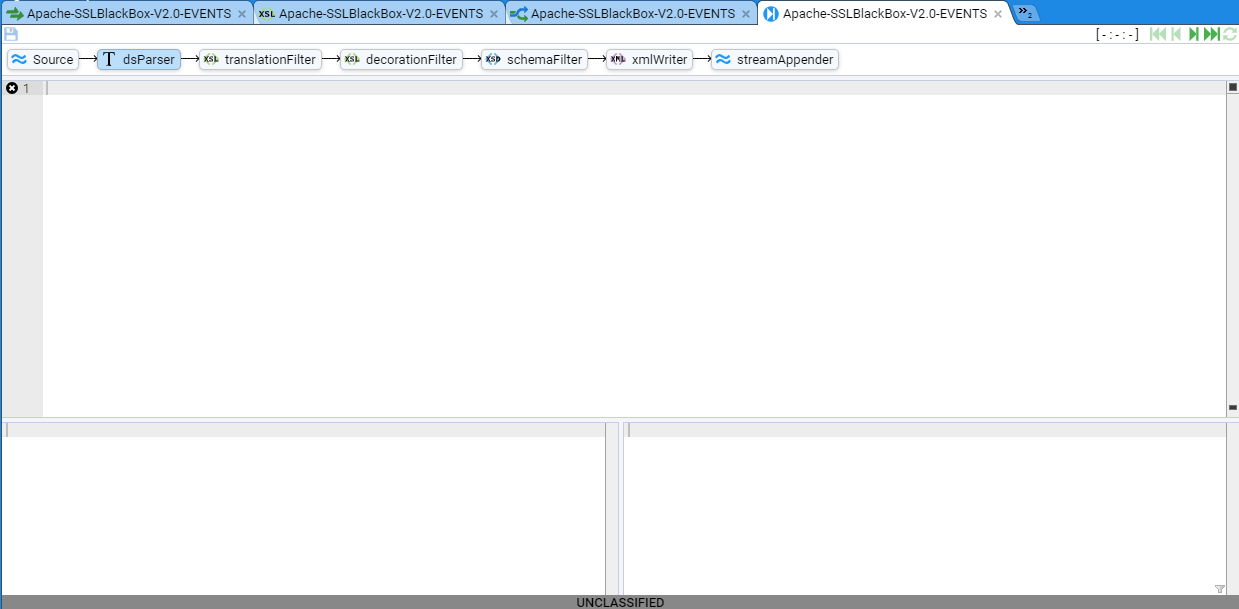
 icon the error will disappear and the stepping window will show.
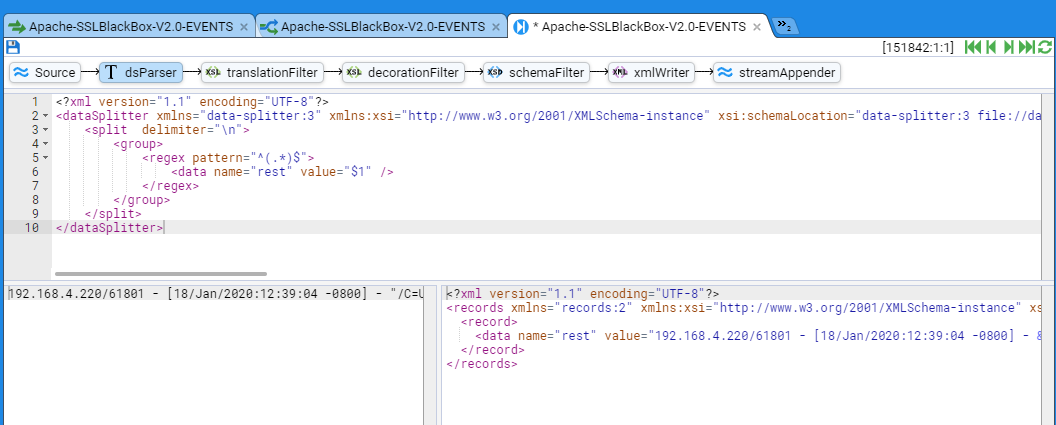
 icon we will see the output pane contain
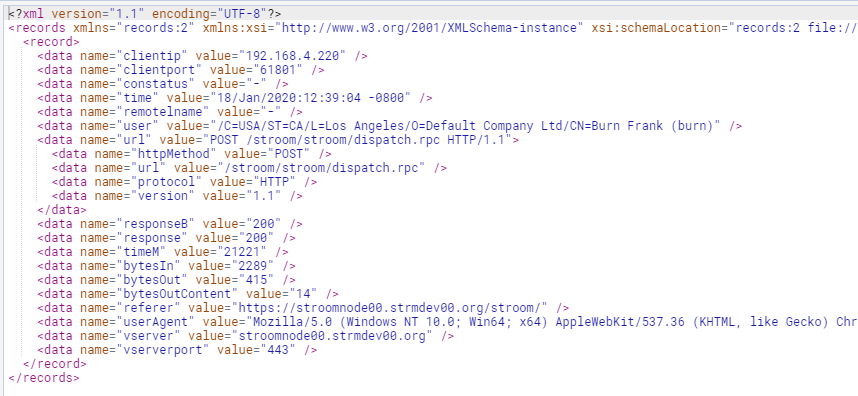
 icon we will see the next event displayed in both the input and output panes.
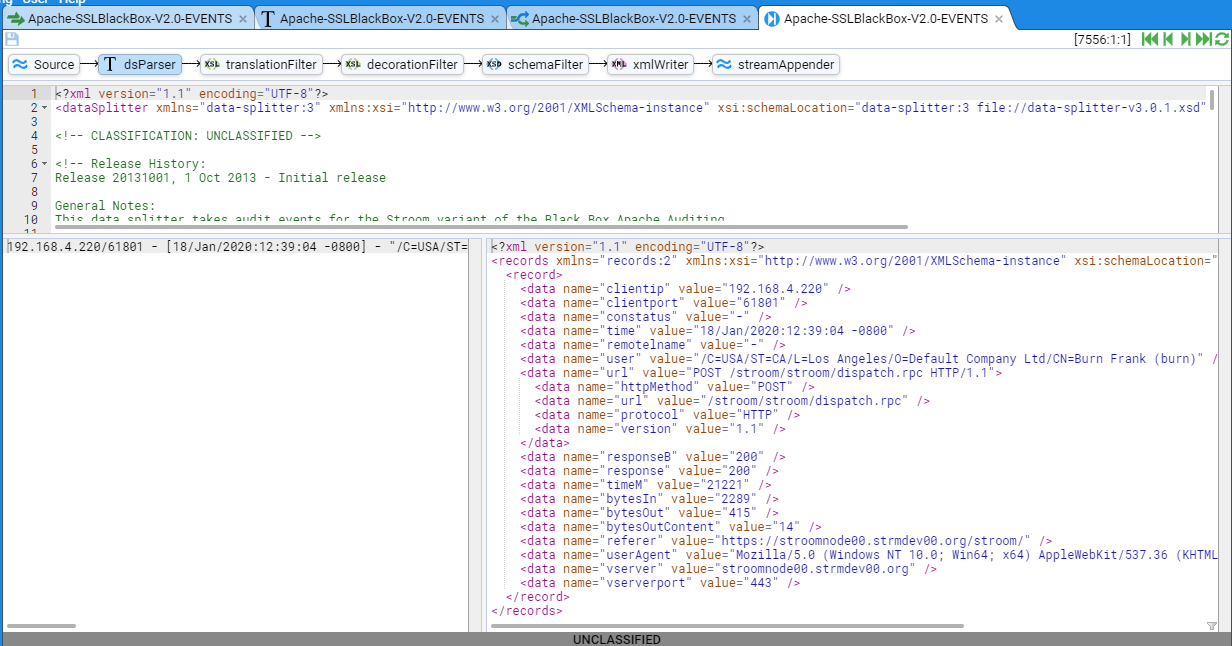
 icon we will see the last event displayed in both the input and output panes.
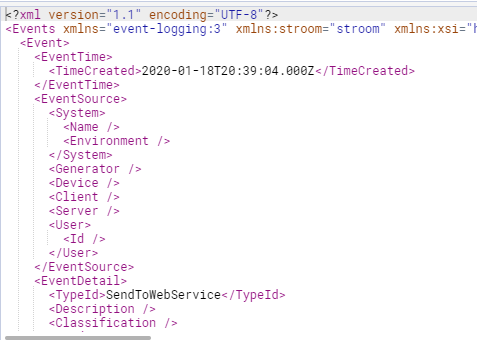
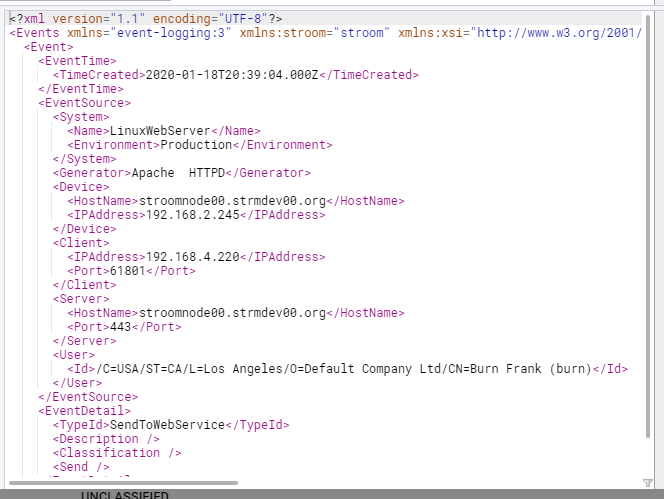
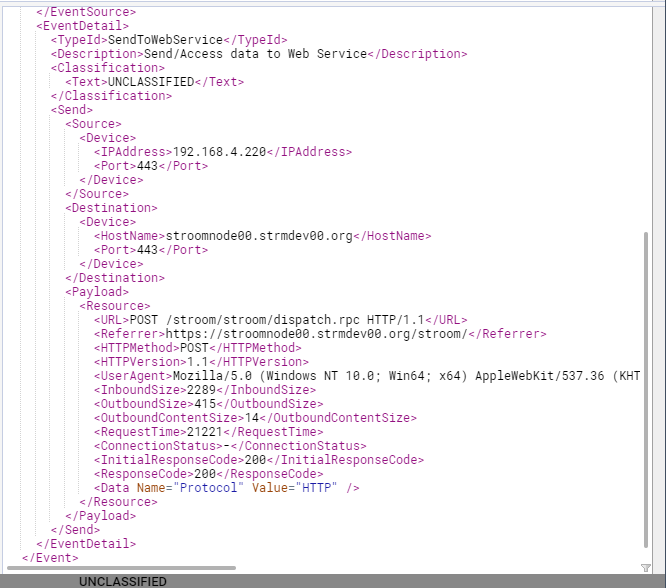
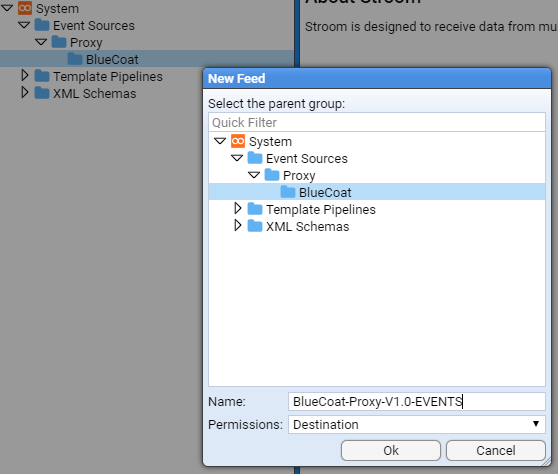
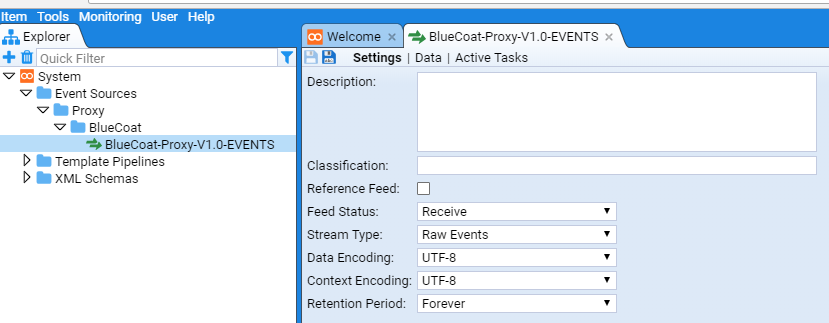
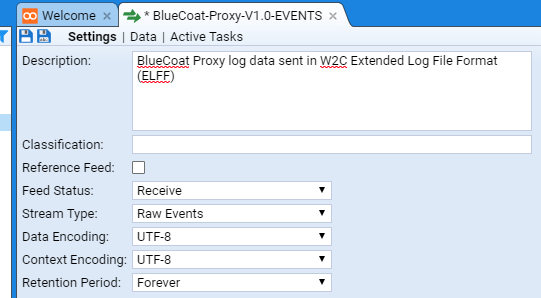
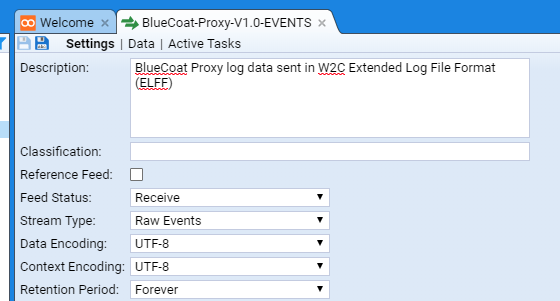




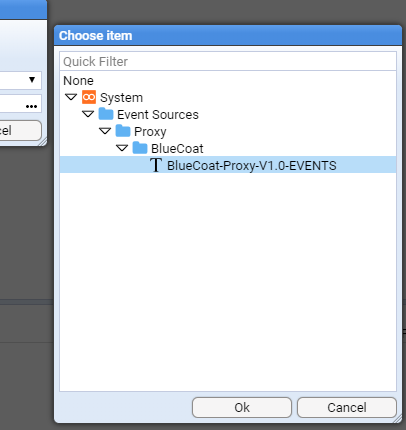
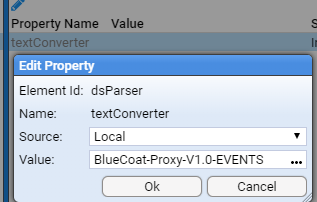


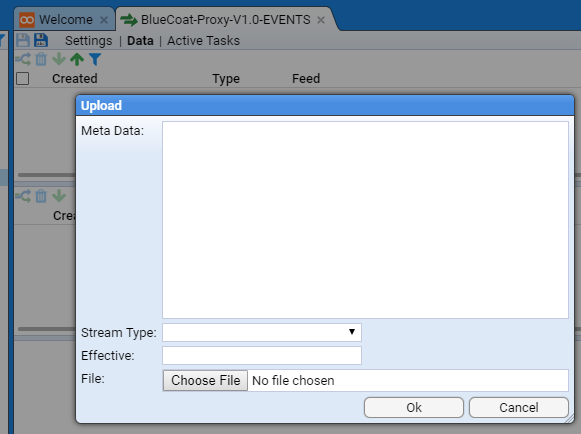
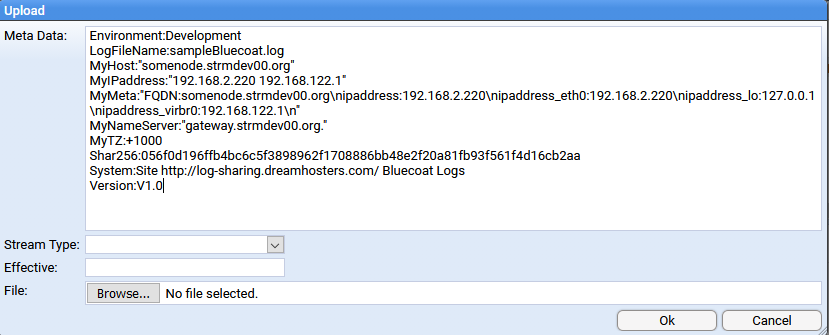
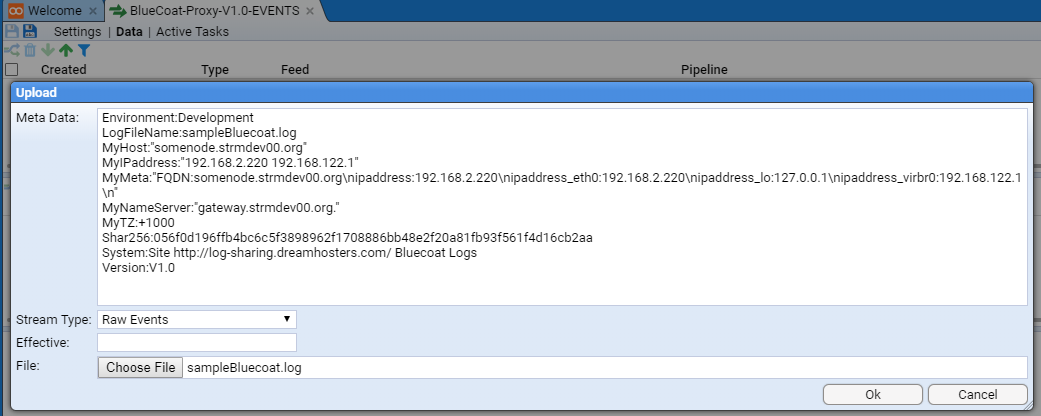


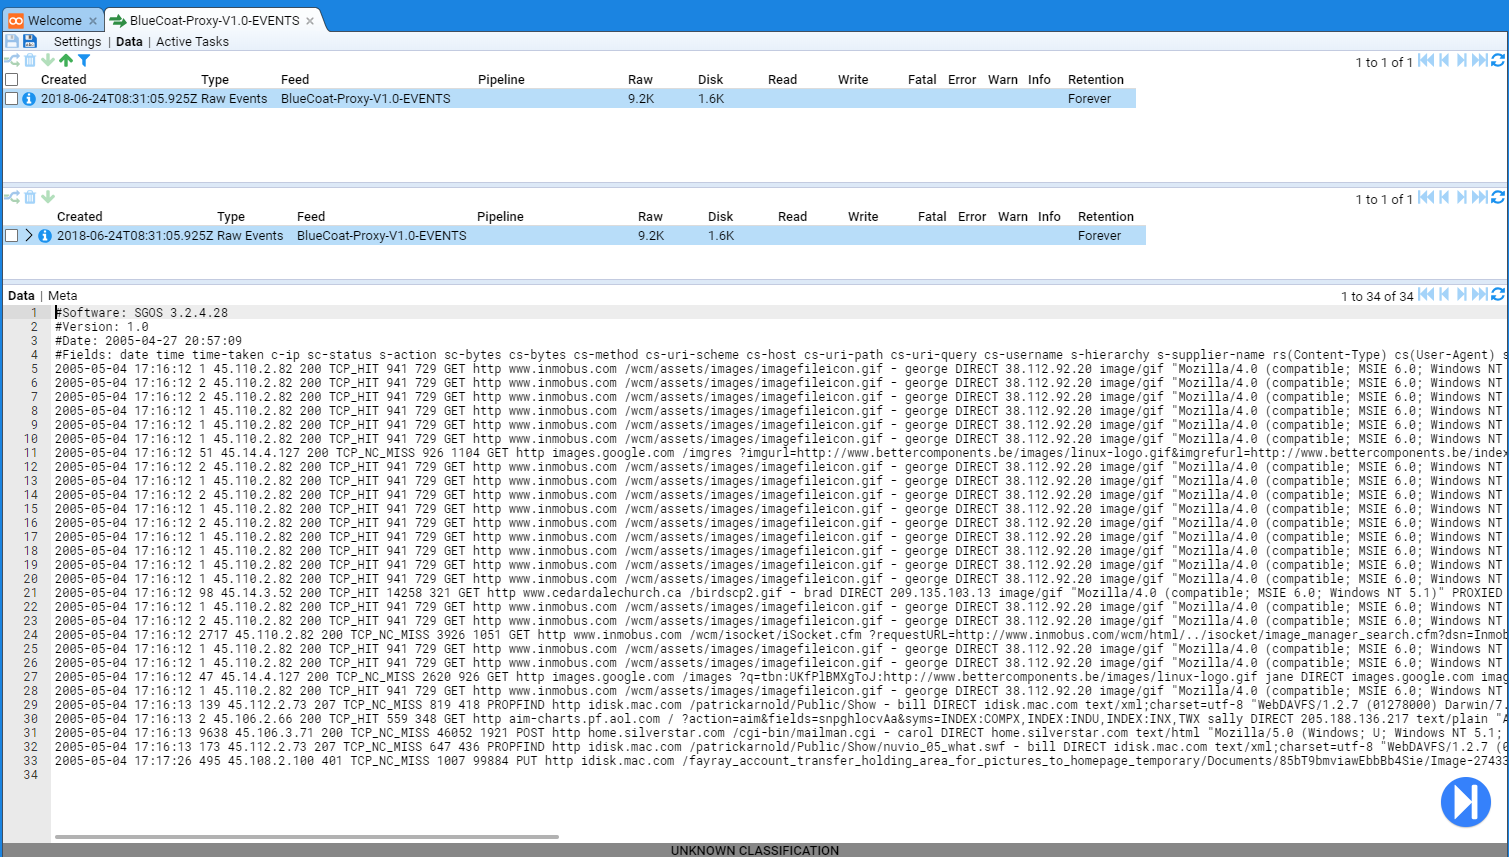
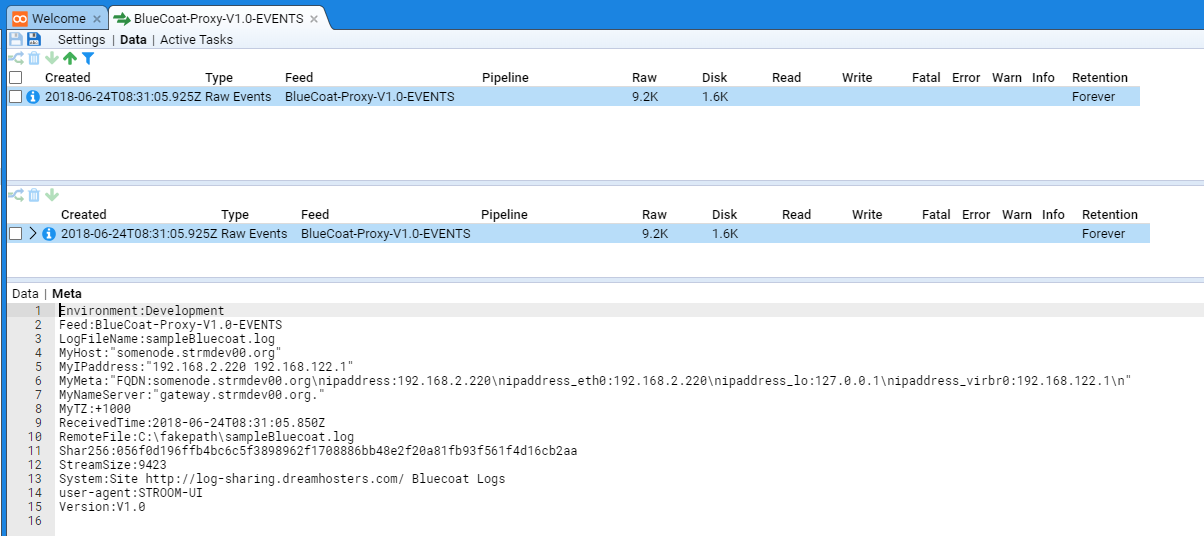
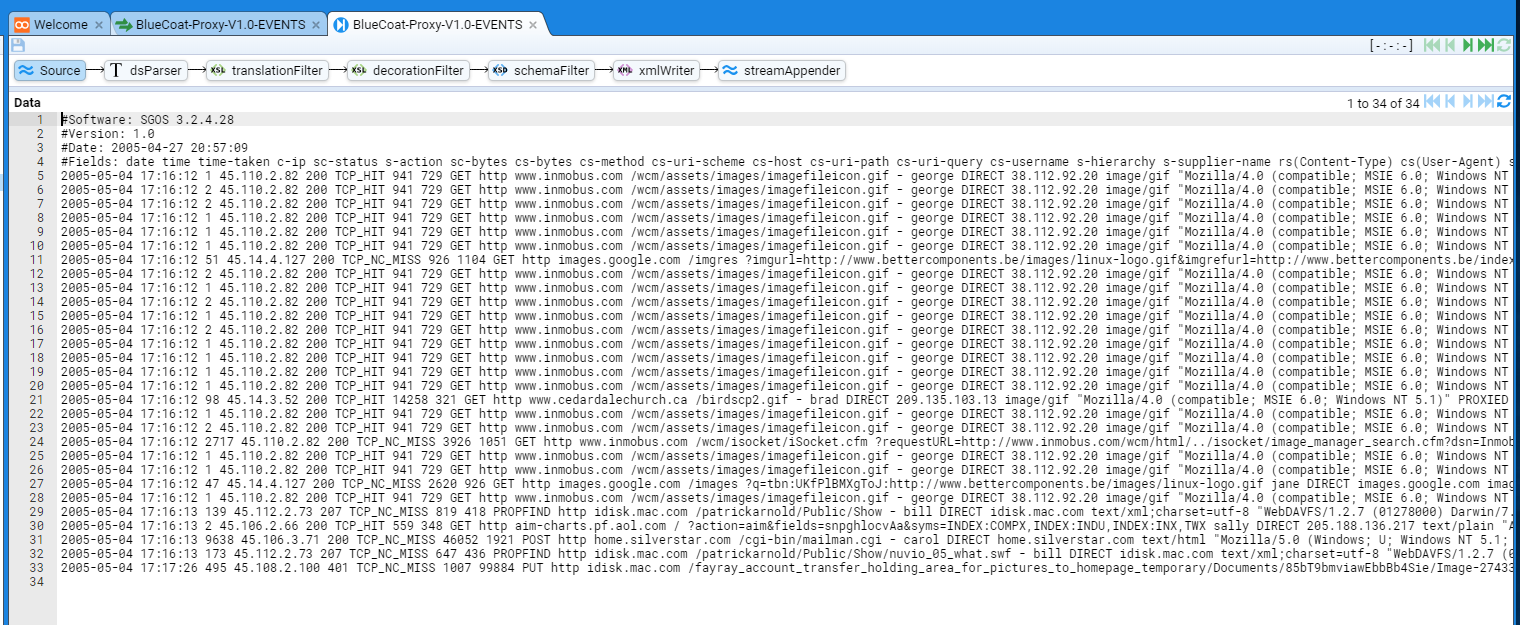
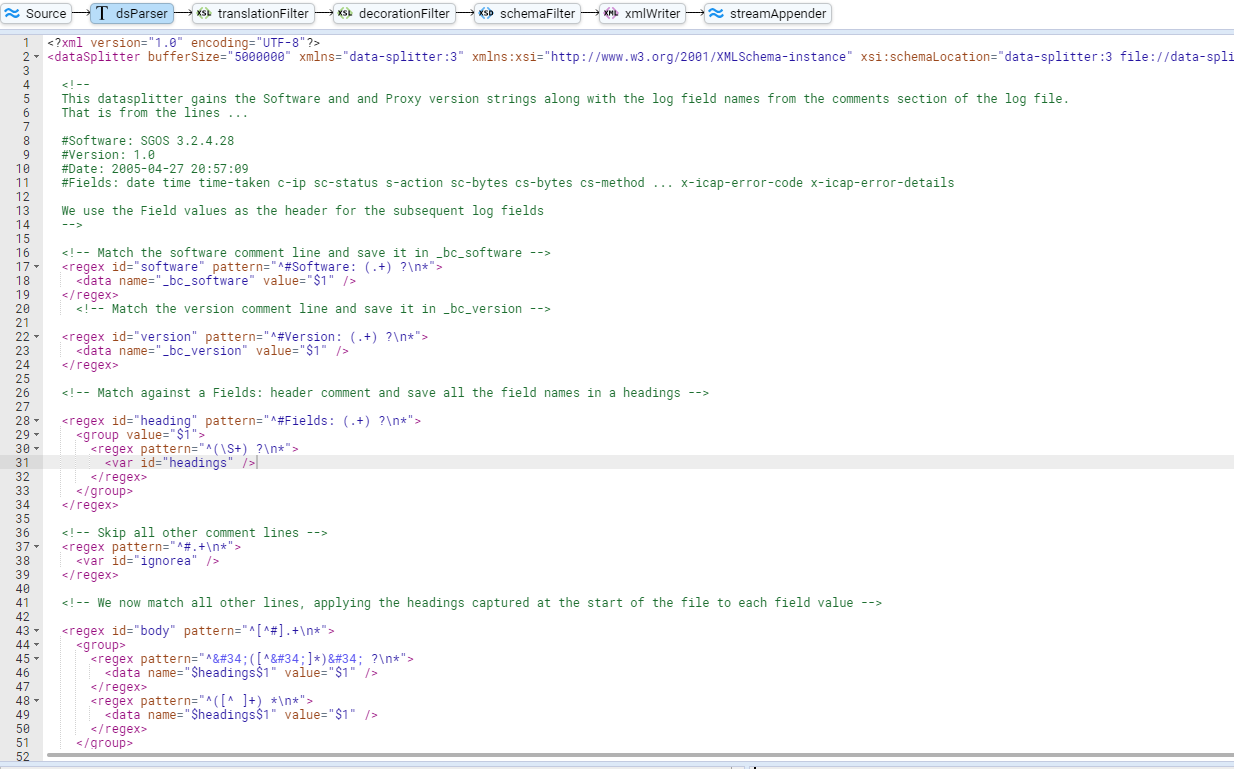
 - progress the transformation one step backward
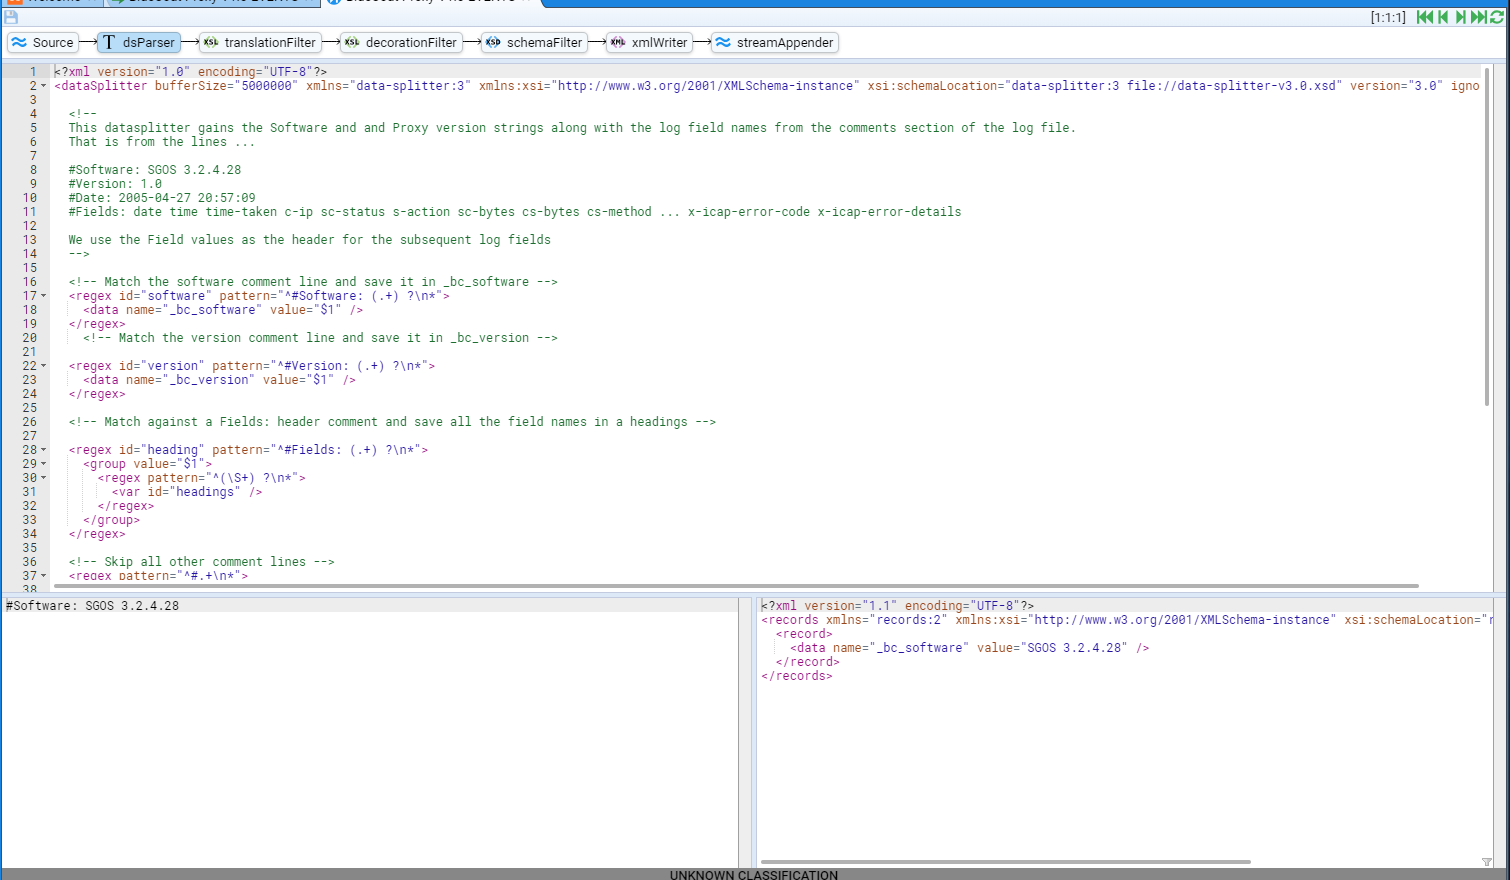




 in the left hand gutter.


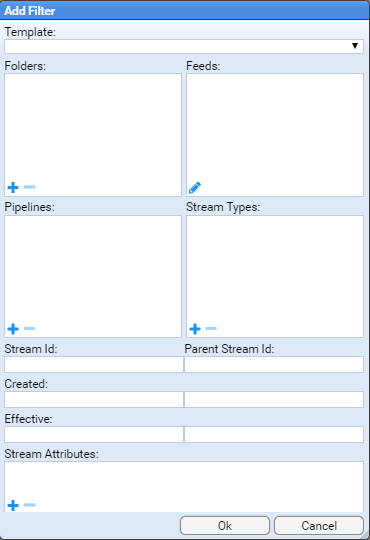
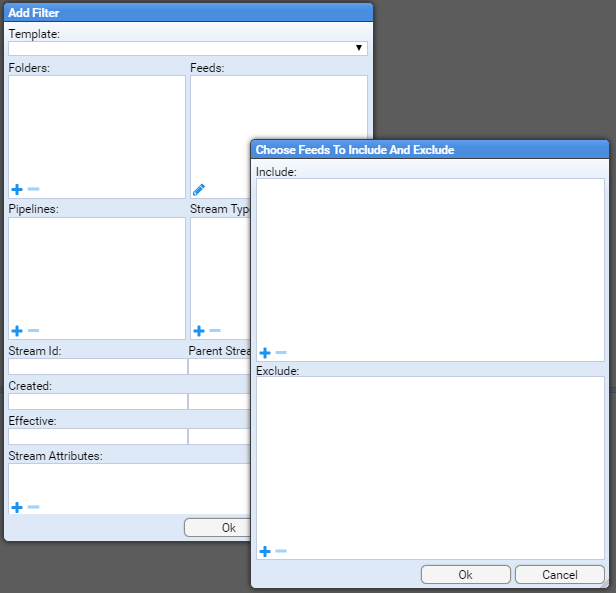
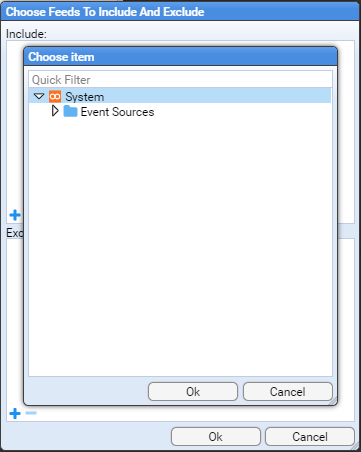
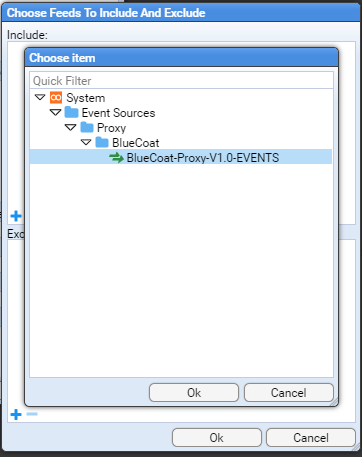
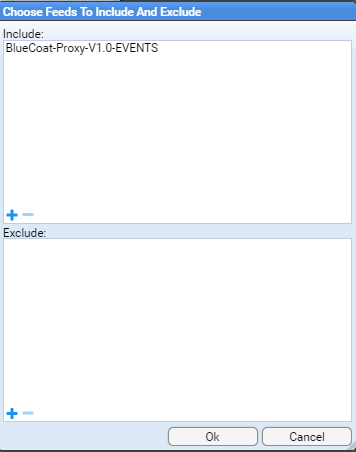
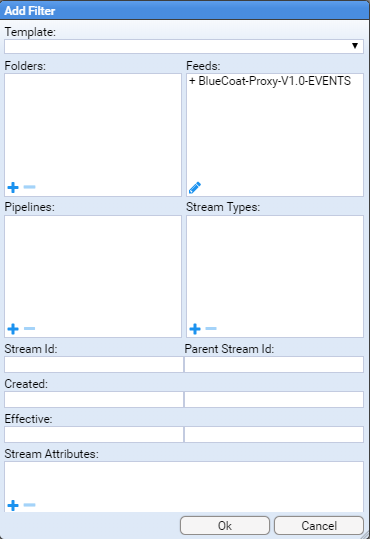
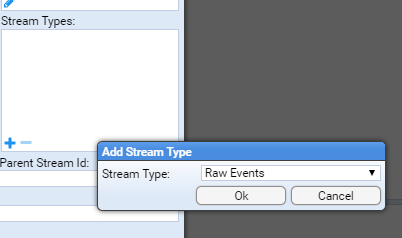
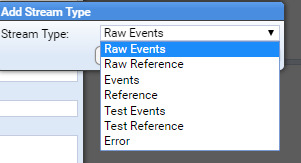
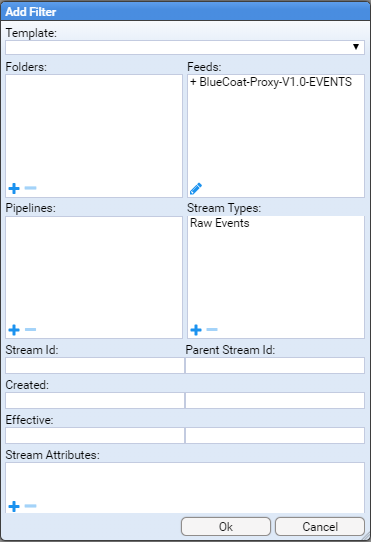
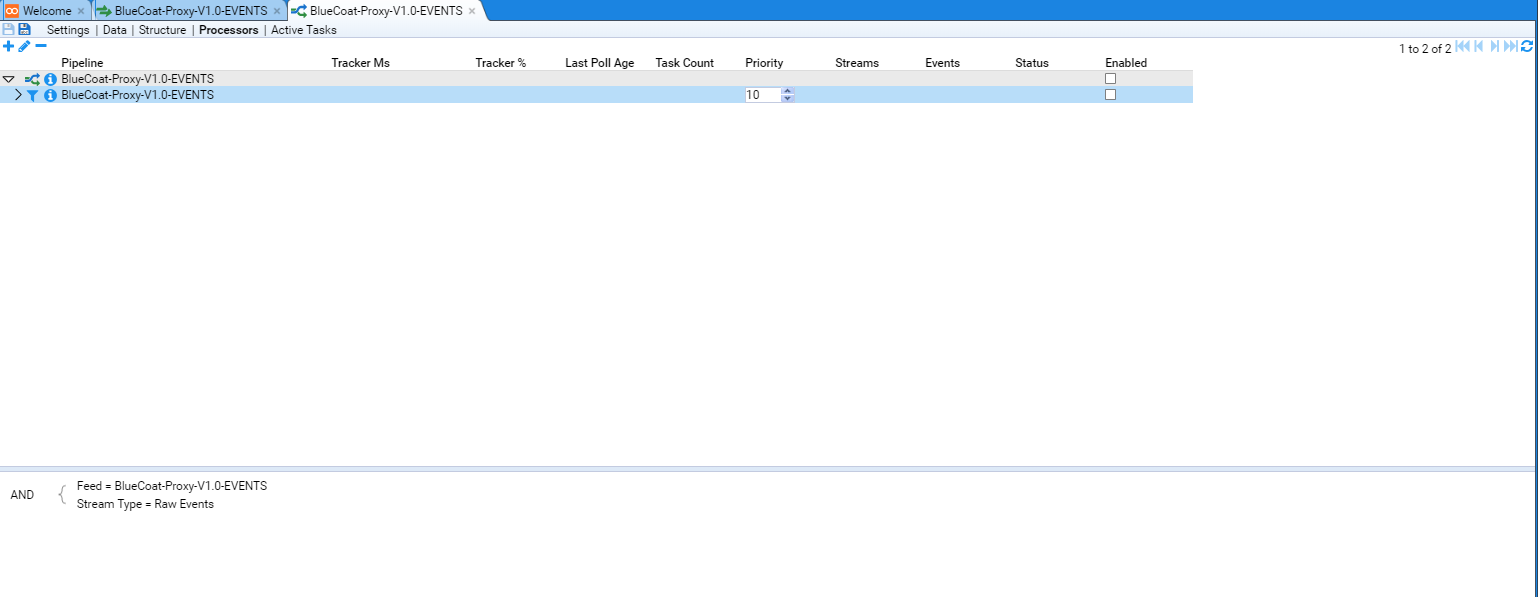


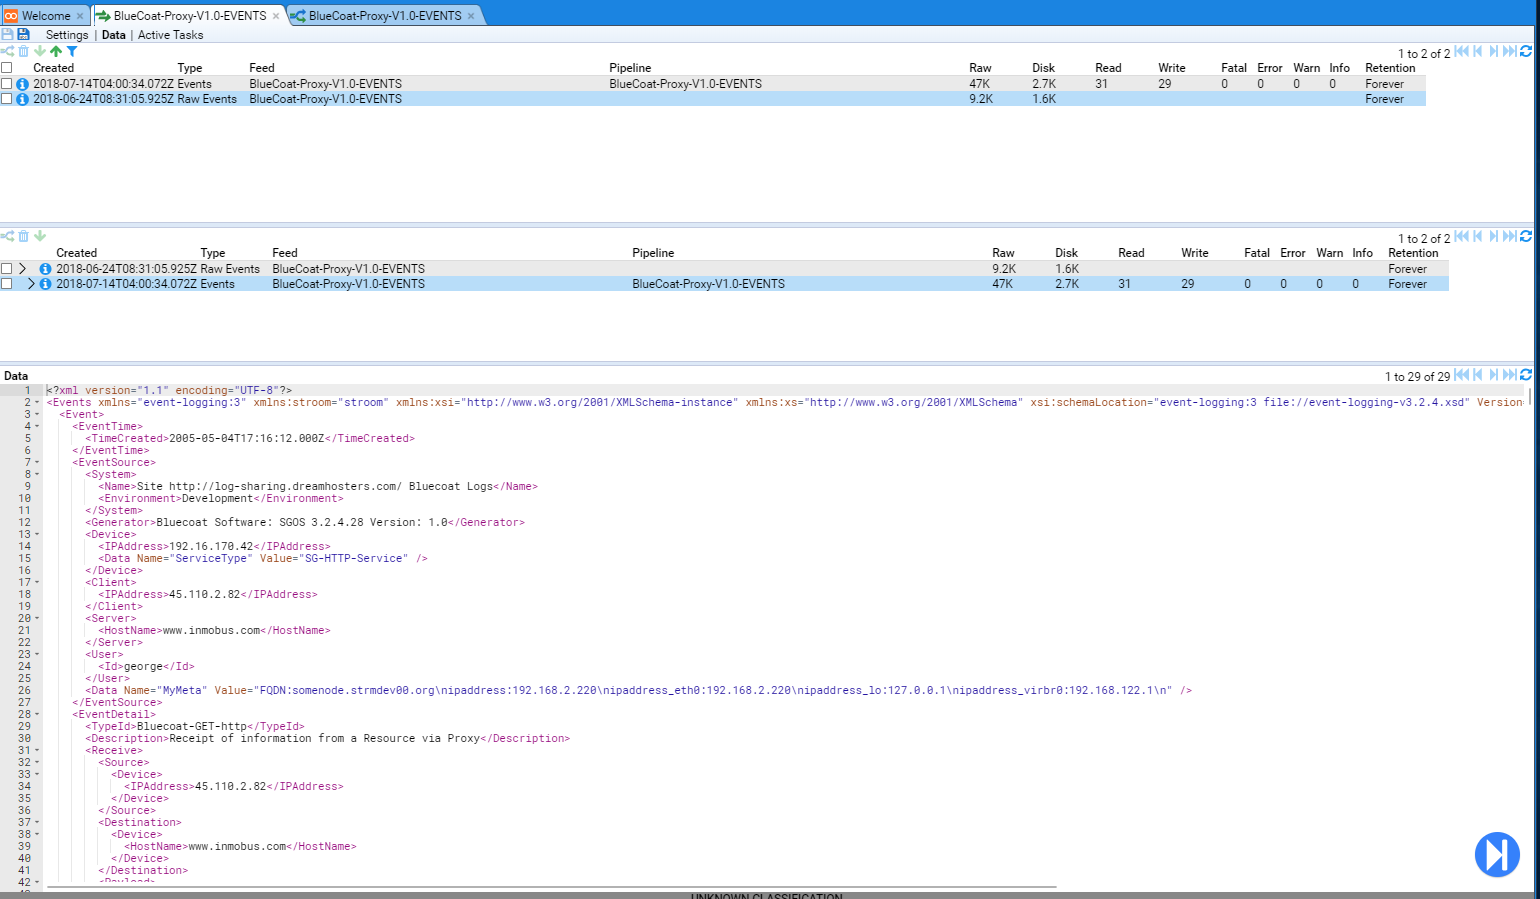


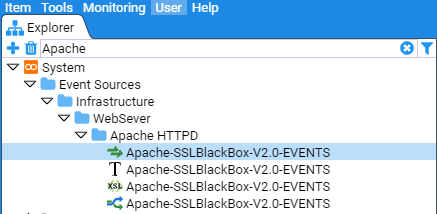

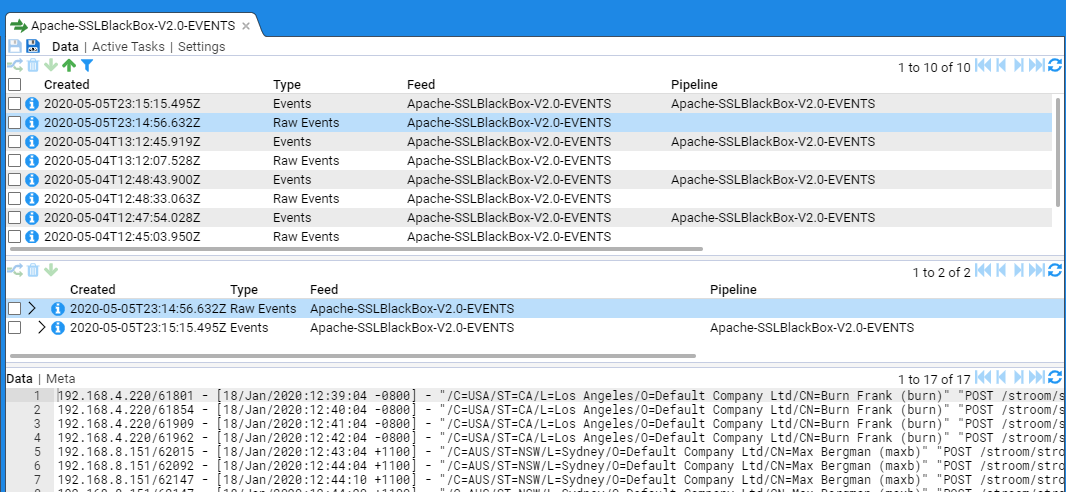

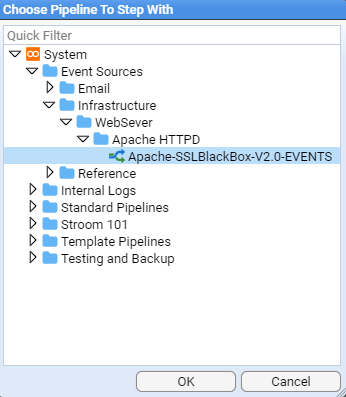

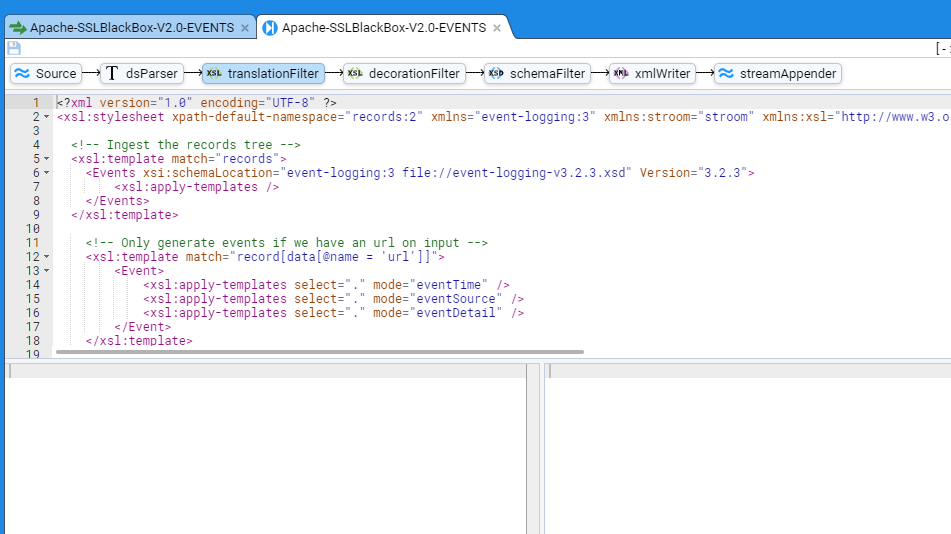
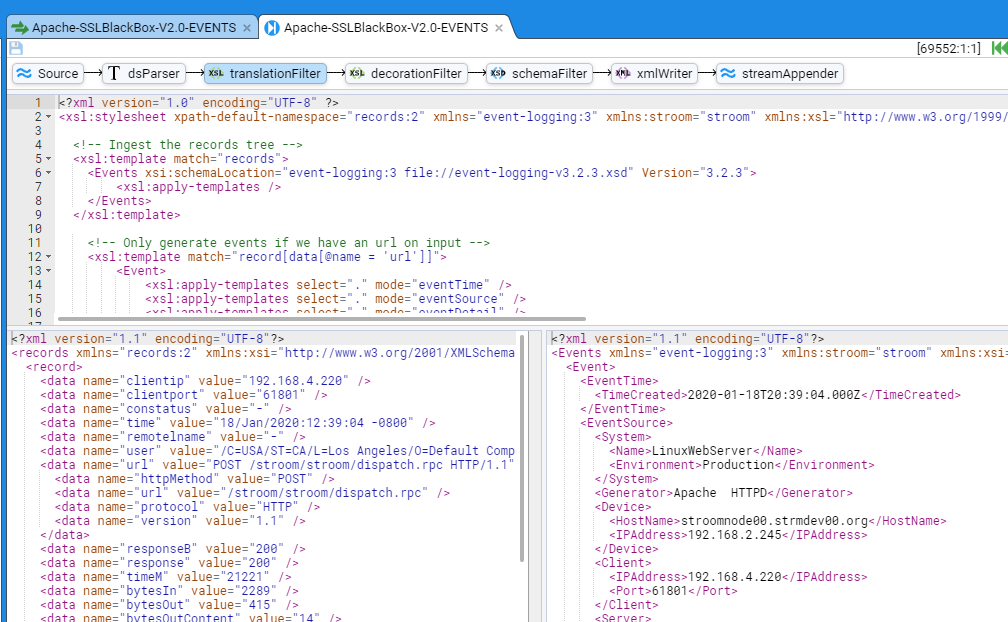
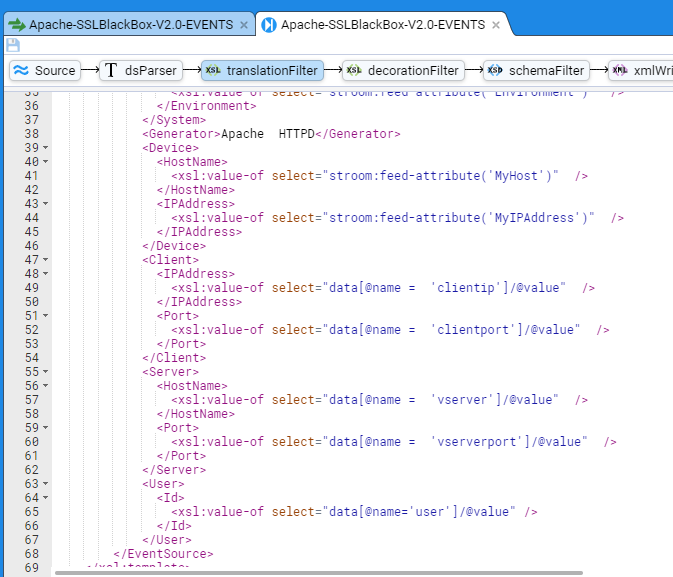
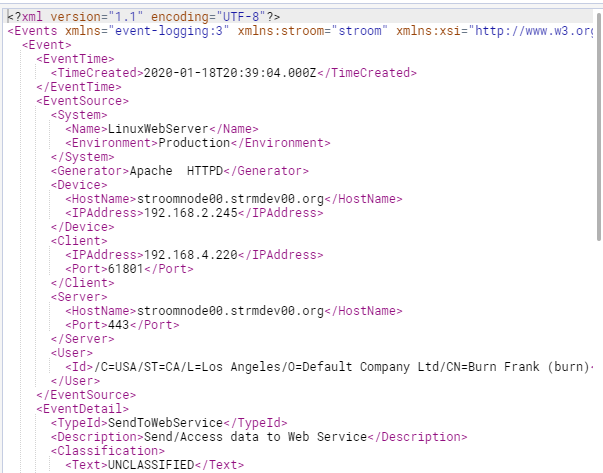


 icon.
icon.

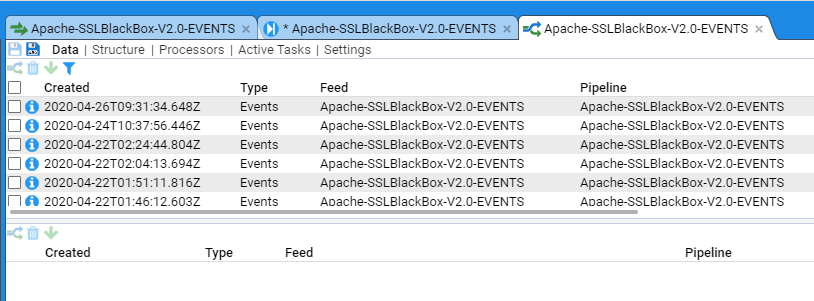

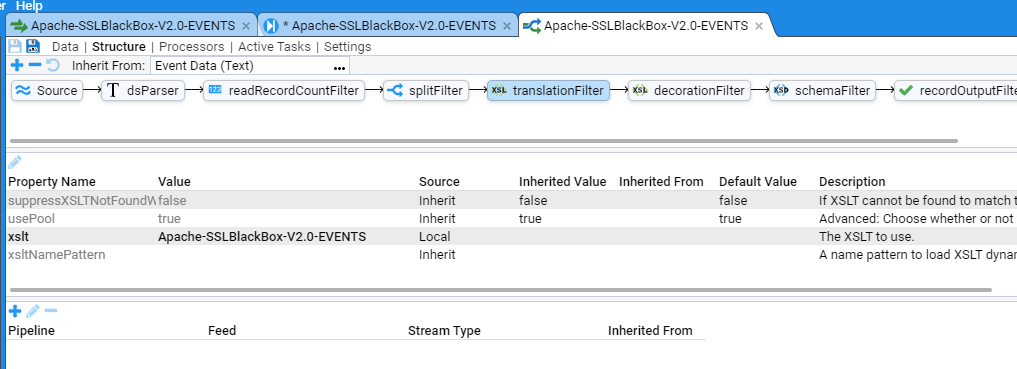
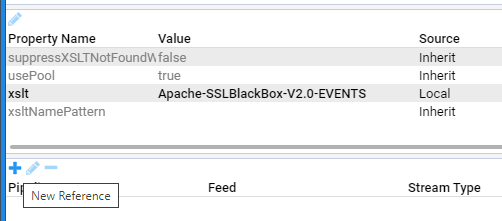
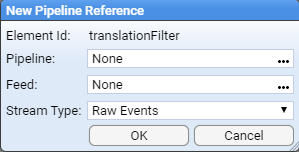
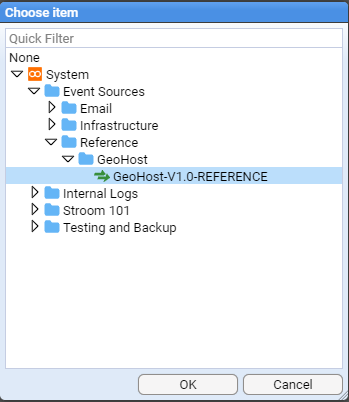
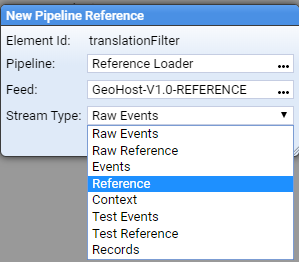
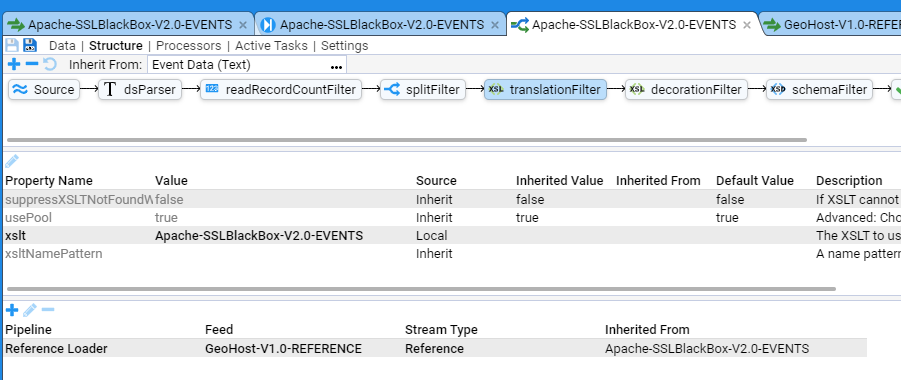
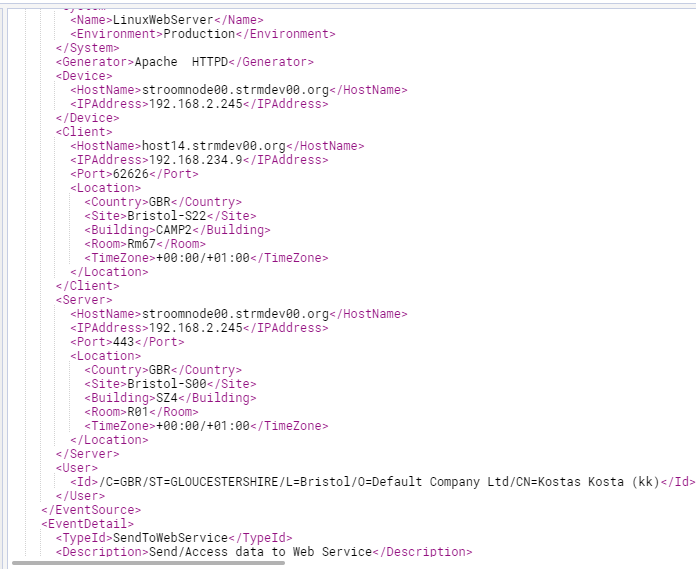
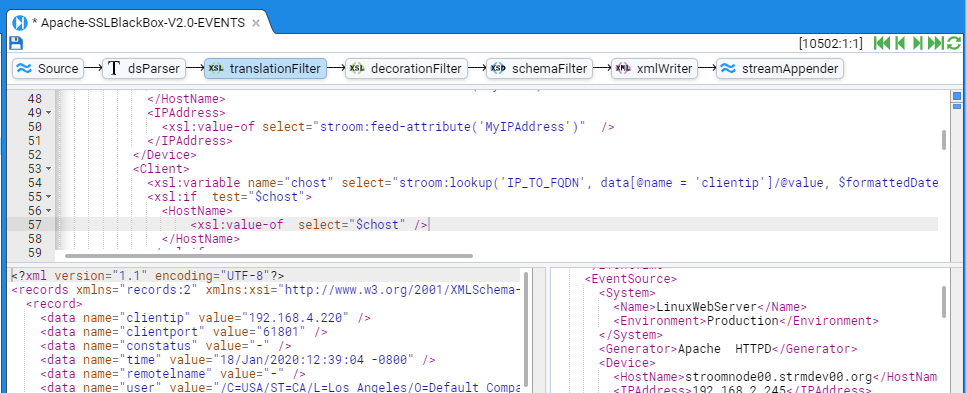

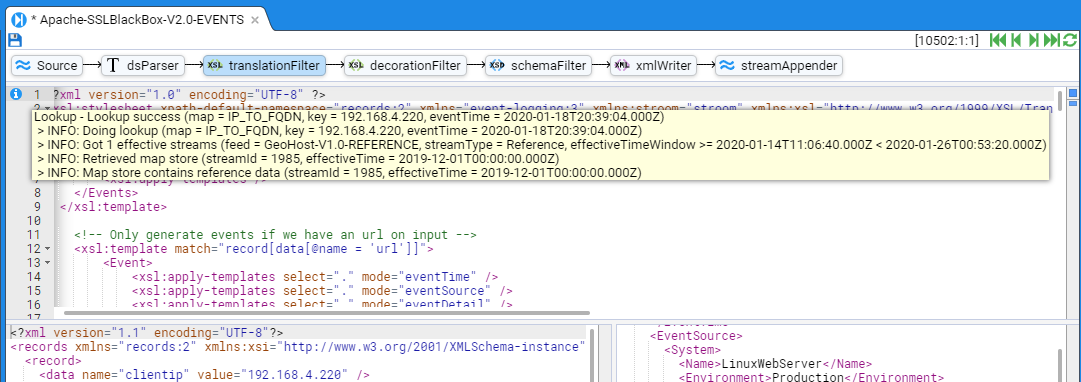

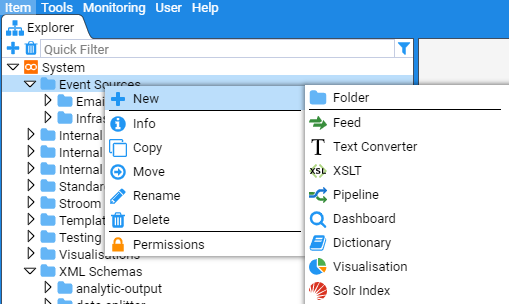
 Feed icon and right click to select.
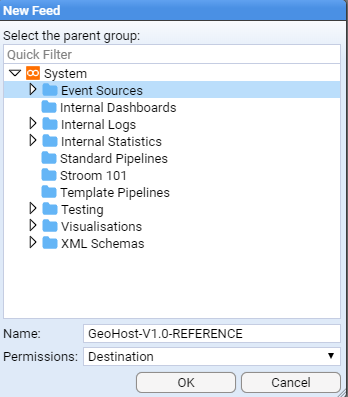

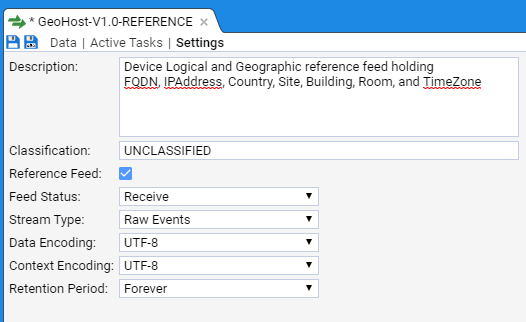
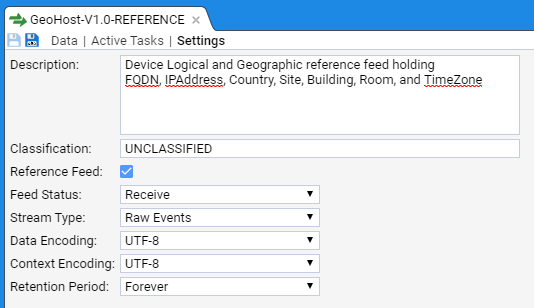
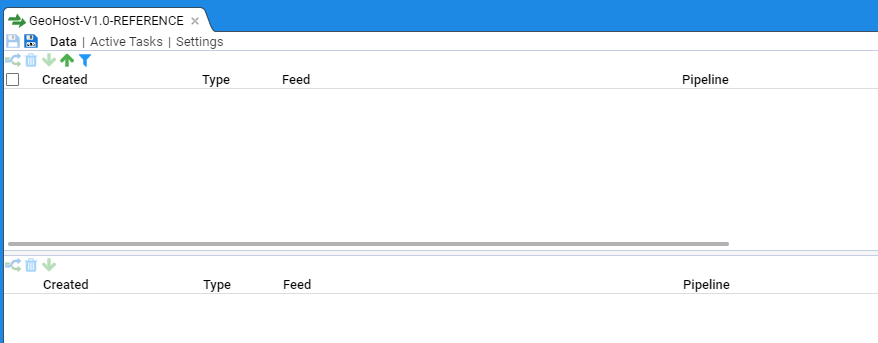

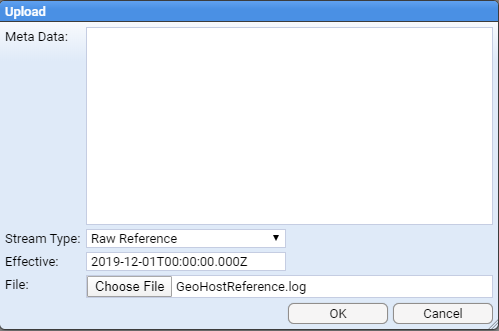


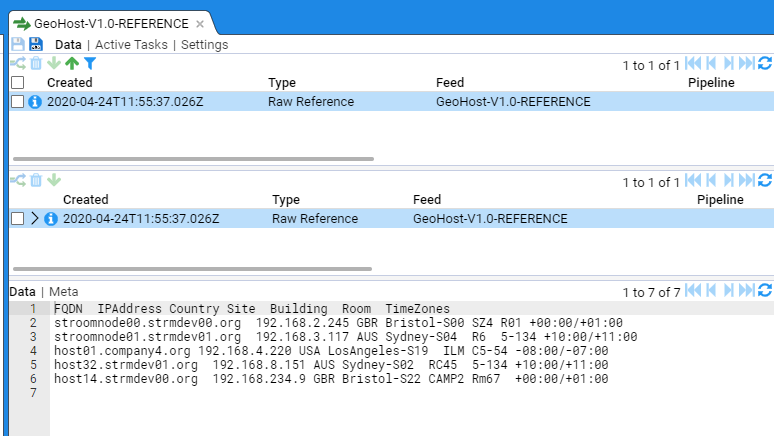
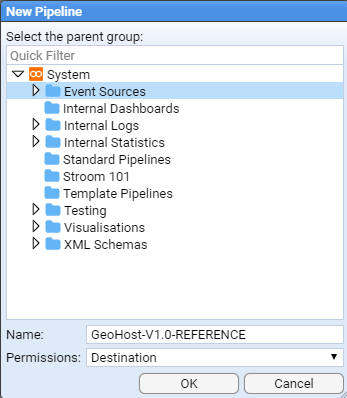
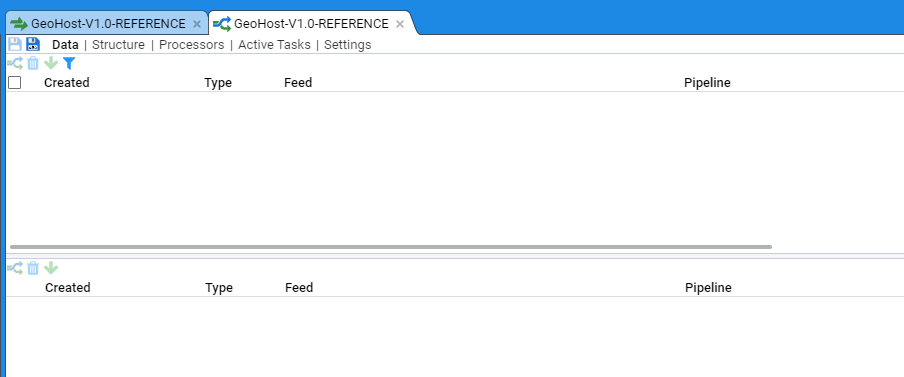


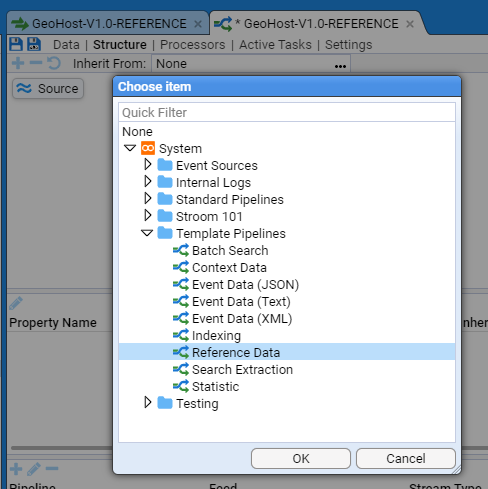


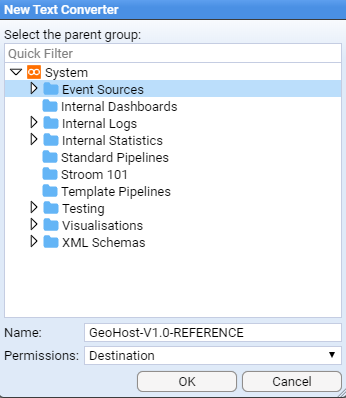


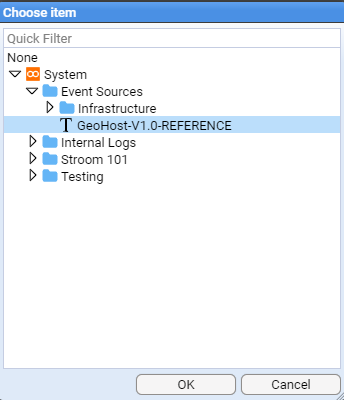
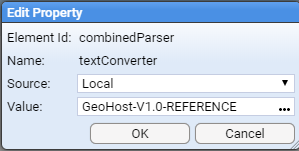

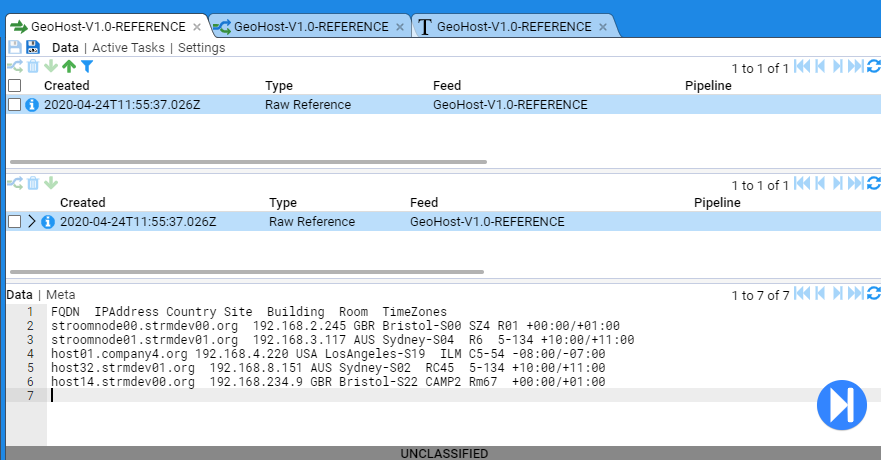

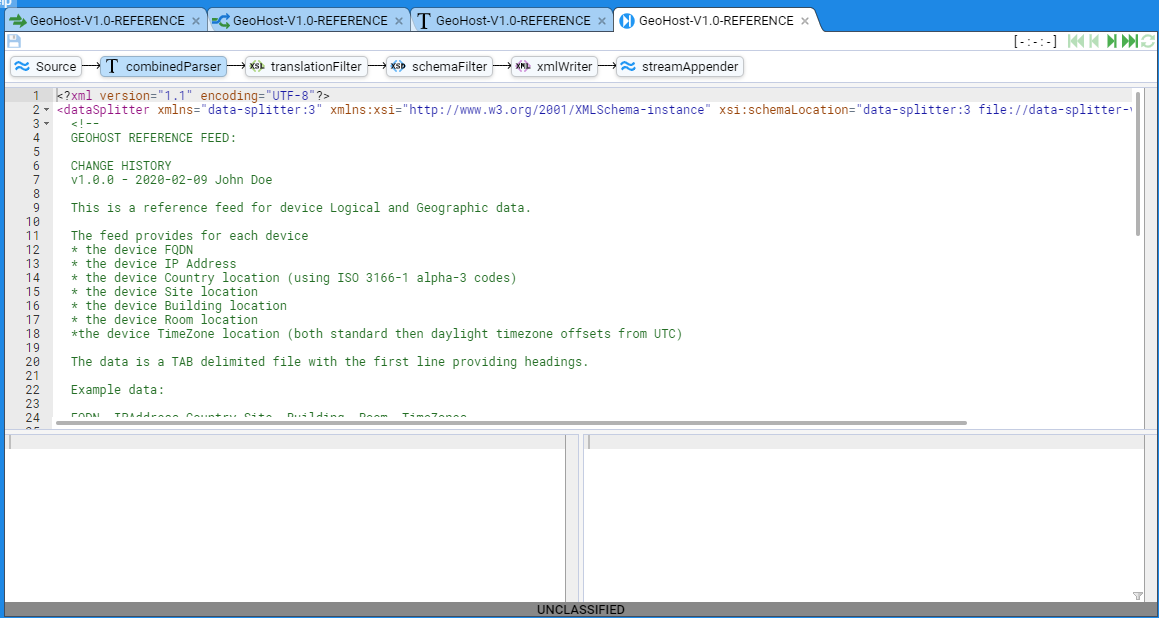
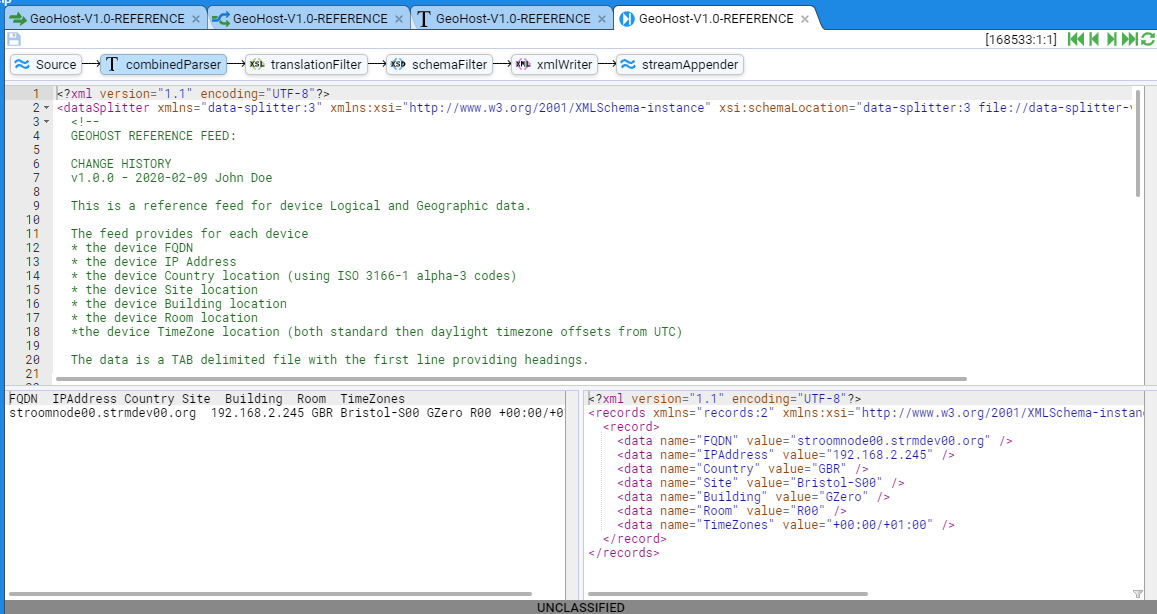


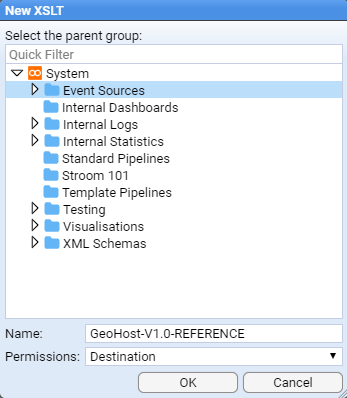


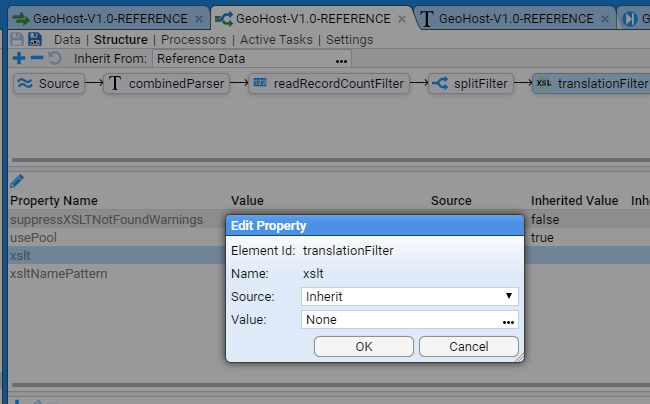
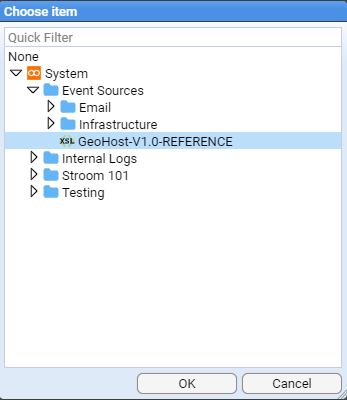
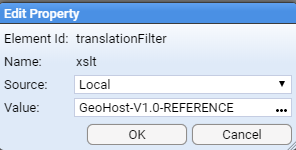

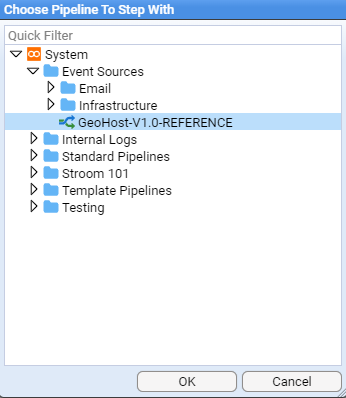
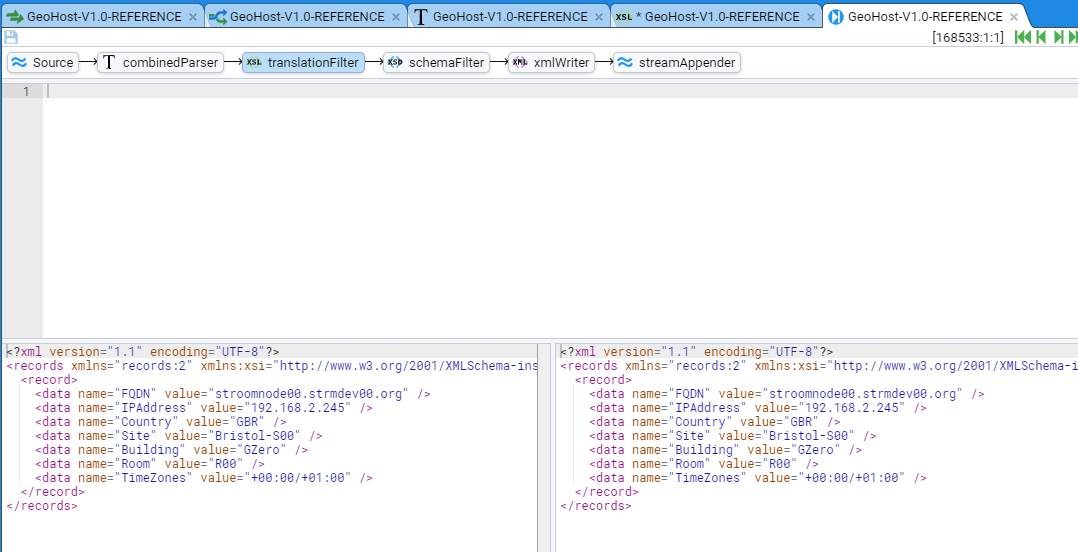
 icon.
icon.