This is the multi-page printable view of this section. Click here to print.
General
- 1: Enabling Processors
- 2: Explorer Management
- 3: Feed Management
- 4: Raw Source Tracking
- 5: Task Management
1 - Enabling Processors
Introduction
A pipeline is a structure that allows for the processing of streams of data.
Once you have defined a pipeline, built its structure, and tested it via ‘Stepping’ the pipeline, you will want to enable the automatic processing of raw event data streams.
In this example we will build on our Apache-SSLBlackBox-V2.0-EVENTS event feed and enable automatic processing of raw event data streams.
If this is the first time you have set up pipeline processing on your Stroom instance you may need to check that the Stream Processor job is enabled on your Stroom instance.
Refer to the Stream Processor Tasks section of the Stroom HOWTO - Task Maintenance
documentation for detailed instruction on this.
Pipeline
Initially we need to open the Apache-SSLBlackBox-V2.0-EVENTS pipeline.
Within the Explorer pane, navigate to the Apache HTTPD folder, then double click on the
 Apache-SSLBlackBox-V2.0-EVENTS Pipeline
to bring up the Apache-SSLBlackBox-V2.0-EVENTS pipeline configuration tab
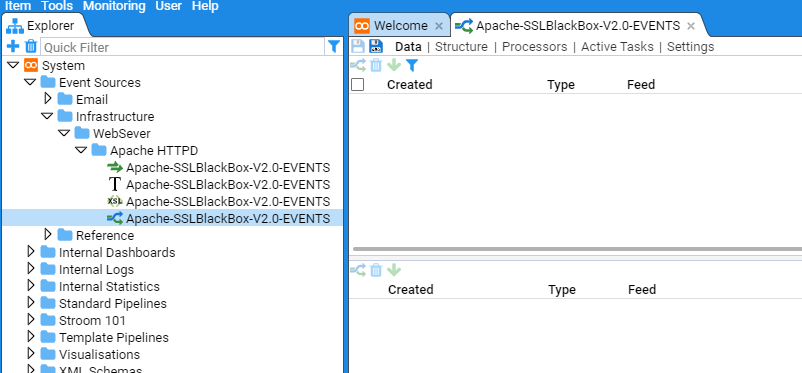
Next, select the Processors sub-item to show
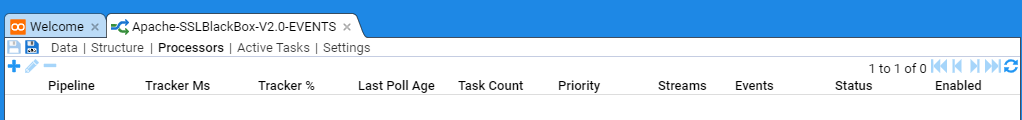
This configuration tab is divided into two panes. The top pane shows the current enabled Processors and any recently processed streams and the bottom pane provides meta-data about each Processor or recently processed streams.
Add a Processor
We now want to add A Processor for the Apache-SSLBlackBox-V2.0-EVENTS pipeline.
First, move the mouse to the Add Processor
 icon at the top left of the top pane.
Select by left clicking this icon to display the Add Filter selection window
icon at the top left of the top pane.
Select by left clicking this icon to display the Add Filter selection window
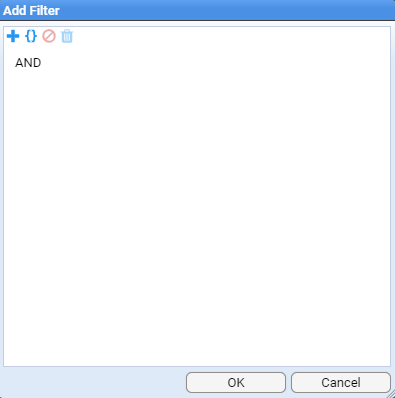
This selection window allows us to filter what set of data streams we want our Processor to process. As our intent is to enable processing for all Apache-SSLBlackBox-V2.0-EVENT streams, both already received and yet to be received, then our filtering criteria is just to process all Raw Events streams for this feed, ignoring all other conditions.
To do this, first click on the Add Term
icon.
Keep the term and operator at the default settings, and select the Choose item
 icon to navigate to the desired feed name (Apache-SSLBlackBox-V2.0-EVENT) object
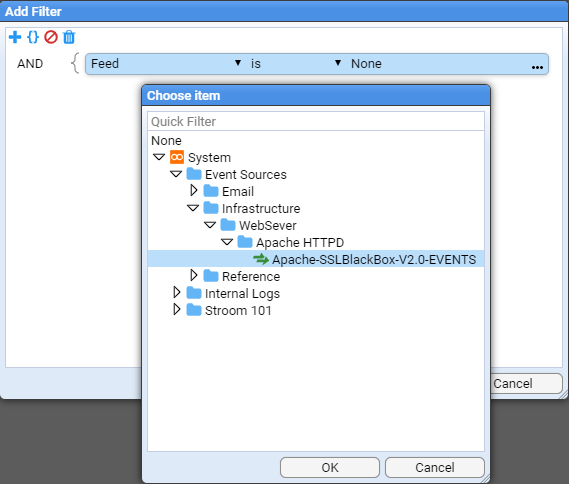
and press OK to make the selection.
Next, we select the required stream type.
To do this click on the Add Term
icon again.
Click on the down arrow to change the Term selection from Feed to Type.
Click in the Value position on the highlighted line (it will be currently empty).
Once you have clicked here a drop-down box will appear as per
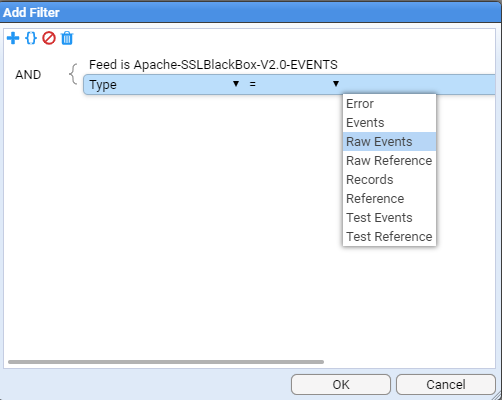
at which point, select the Stream Type of Raw Events and then press OK. At this we return to the Add Processor selection window to see that the Raw Events stream type has been added.
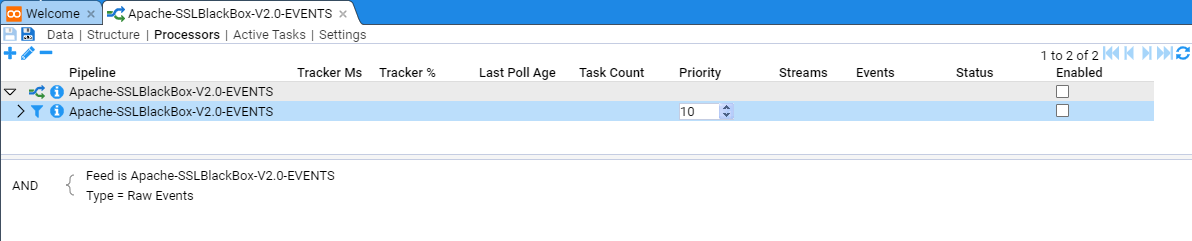
If the expected feed rate is small, for example, NOT operating system or database access feeds, then you would leave the Processor Priority at the default of 10. Typically, Apache HTTPD access events are not considered to have an excessive feed rate (by comparison to operating system or database access feeds), so we leave the Priority at 10.
Note the Processor has been added but it is in a disabled state. We enable both pipeline processor and the processor filter by checking both Enabled check boxes
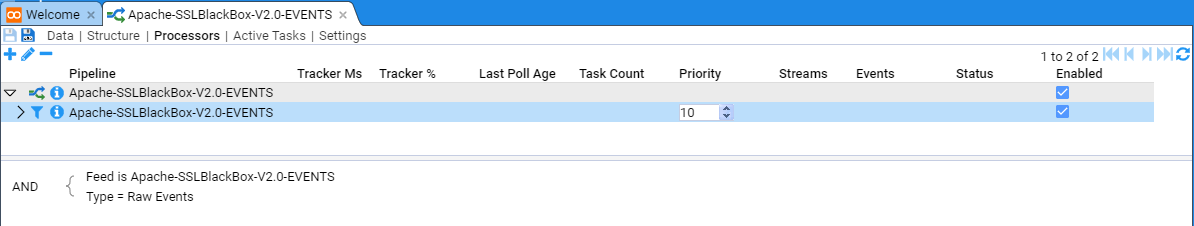
Once the processor has been enabled, at first you will see nothing.
But if you press the
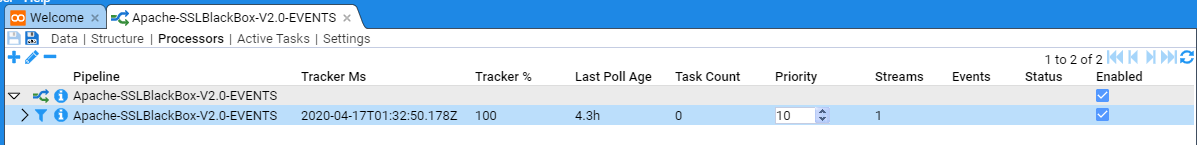
 button at the top of the right of the top pane, you will see that the Child processor has processed a stream, listing the time it did it and also listing the last time the processor looked for more streams to process and how many it found.
If your event feed contained multiple streams you would see the streams count incrementing and the Tracker% incrementing (when the Tracker% reaches 100% then all current streams you filtered for have been processed).
You may need to click on the refresh
icon to see the stream count and Tracker% changes.
button at the top of the right of the top pane, you will see that the Child processor has processed a stream, listing the time it did it and also listing the last time the processor looked for more streams to process and how many it found.
If your event feed contained multiple streams you would see the streams count incrementing and the Tracker% incrementing (when the Tracker% reaches 100% then all current streams you filtered for have been processed).
You may need to click on the refresh
icon to see the stream count and Tracker% changes.
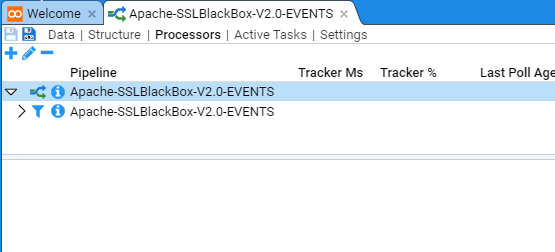
When in the Processors sub-item, if we select the Parent Processor, then no meta-data is displayed
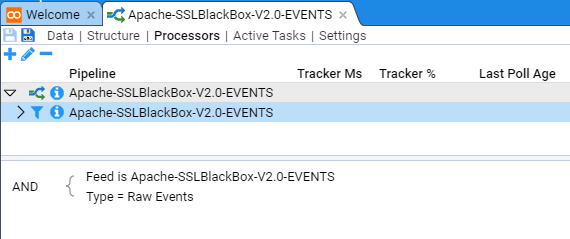
If we select the Parent’s child, then we see the meta-data for this, the actual actionable Processor
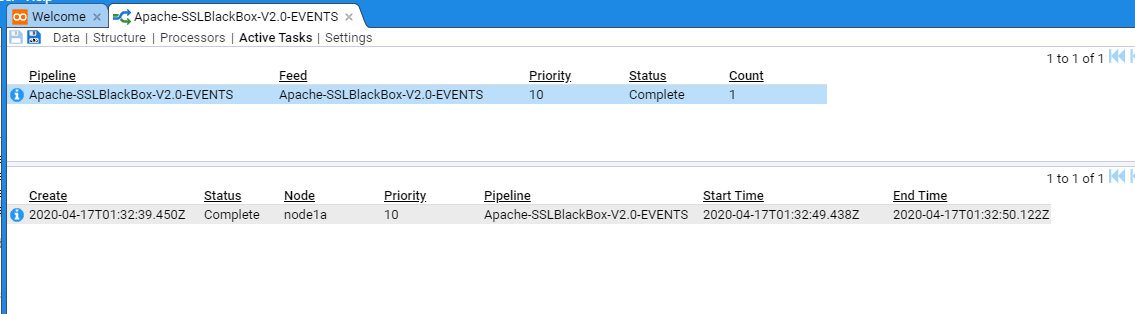
If you select the Active Tasks sub-item, you will see a summary of the recently processed streams
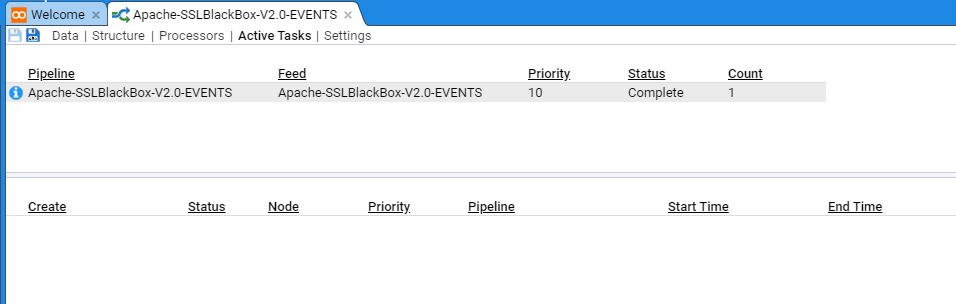
The top pane provides a summary table of recent stream batches processed, based on Pipeline and Feed, and if selected, the individual streams will be displayed in the bottom pane
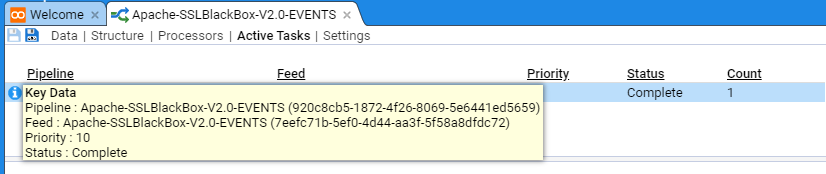
If further detail is required, then left click on the
 icon at the top left of a pane.
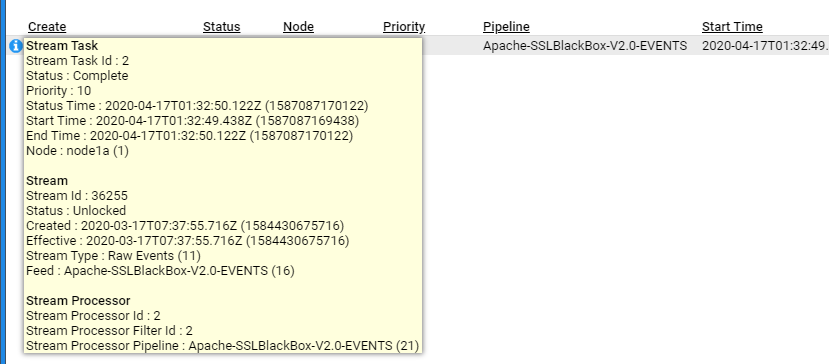
This will reveal additional information such as
icon at the top left of a pane.
This will reveal additional information such as
At this point, if you click on the Data sub-item you will see
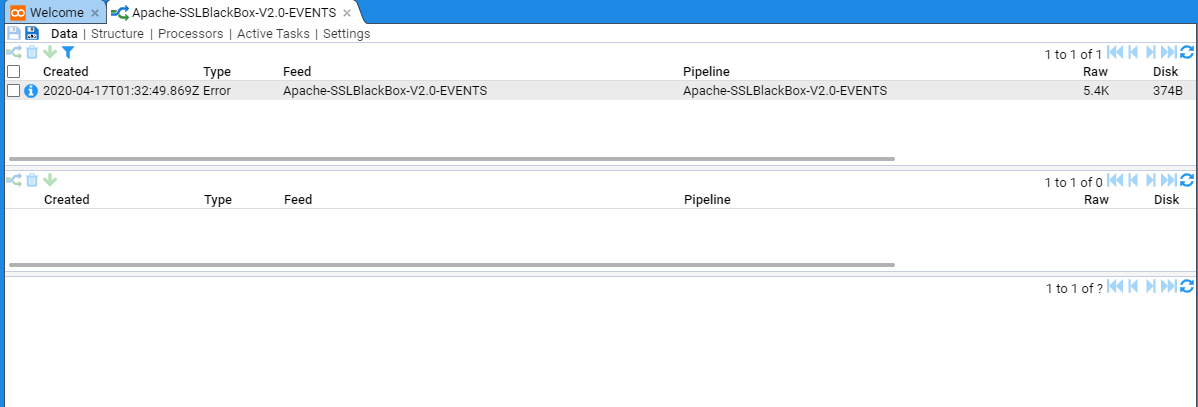
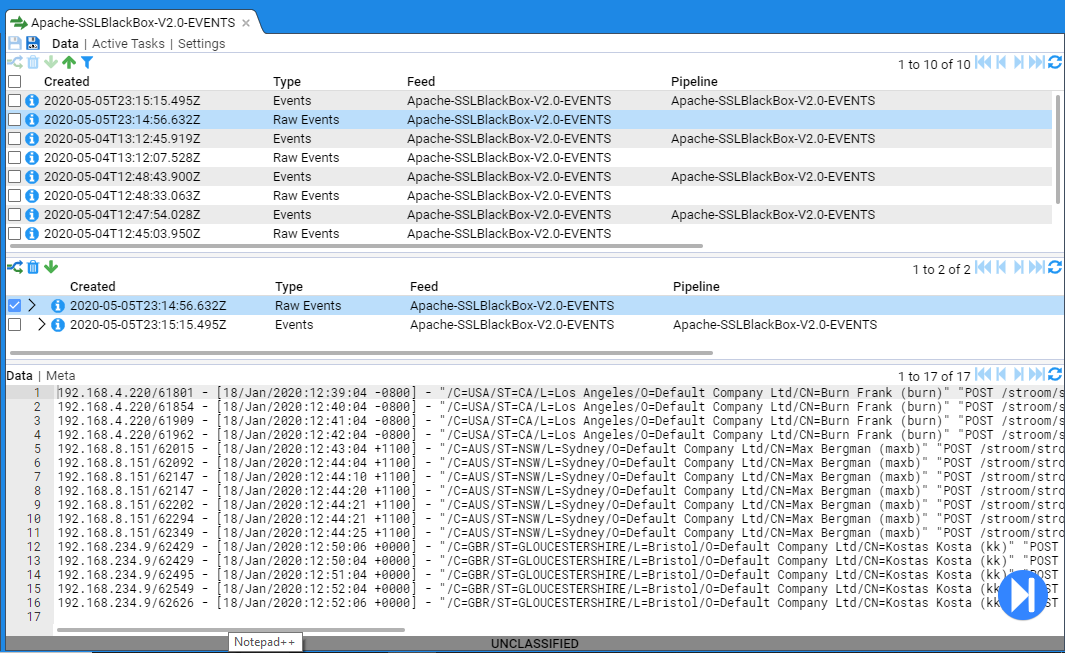
This view displays the recently processed streams in the top pane. If a stream is selected, then the Specific stream and any related streams are displayed in the middle pane and the bottom pane displays the data itself
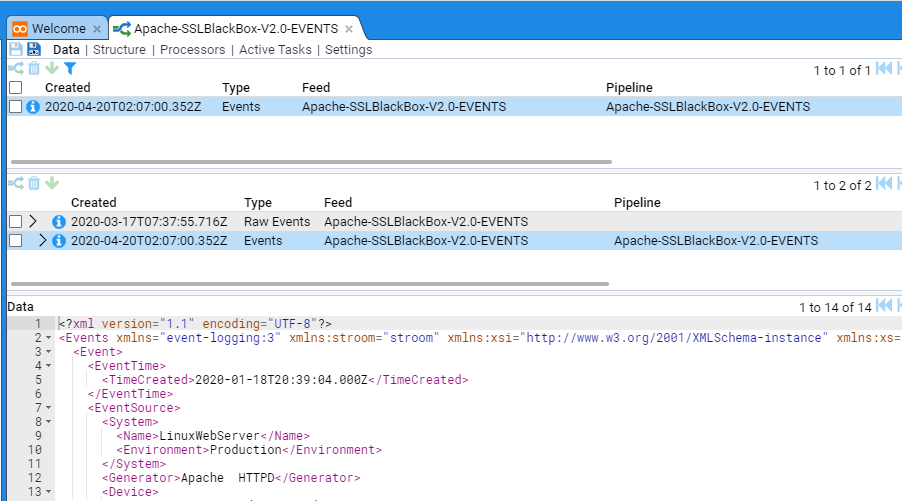
As you can see, the processed stream has an associated Raw Events stream. If we click on that stream we will see the raw data
Processor Errors
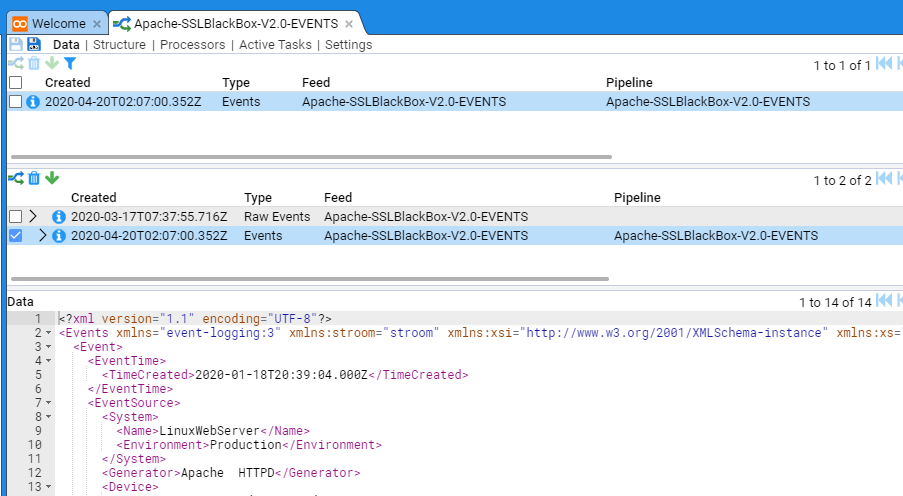
Occasionally you may need to reprocess a stream.
This is most likely required as a result of correcting translation issues during the development phase, or it can occur from the data source having an unexpected change (unnotified application upgrade for example).
You can reprocess a stream by selecting its check box and then pressing the
 icon in the top left of the same pane.
This will cause the pipeline to reprocess the selected stream.
One can only reprocess Event or Error streams.
icon in the top left of the same pane.
This will cause the pipeline to reprocess the selected stream.
One can only reprocess Event or Error streams.
In the below example we have a stream that is displaying errors (this was due to a translation that did not conform to the schema version).
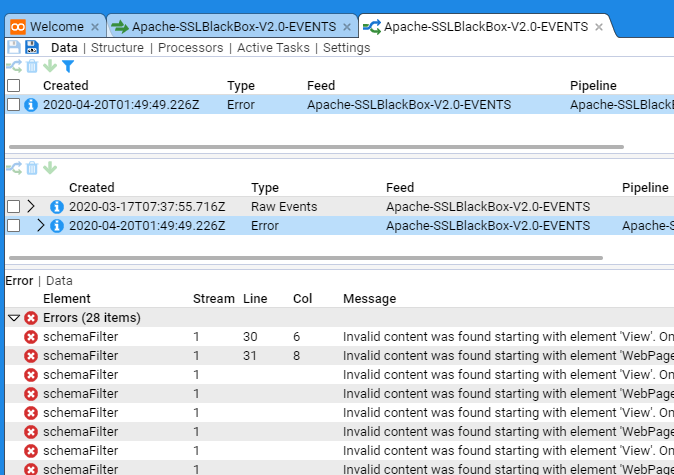
Once the translation was remediated to remove schema issues the pipeline could successfully process the stream and the errors disappeared.
You should be aware that if you need to reprocess bulk streams that there is an upper limit of 1000 streams that can be reprocessed in a single batch. As at Stroom v6 if you exceed this number then you receive no error notification but the task never completes. The reason for this behaviour is to do with database performance and complexity. When you reprocess the current selection of filtered data, it can contain data that has resulted from many pipelines and this requires creation of new processor filters for each of these pipelines. Due to this complexity there exists an arbitrary limit of 1000 streams.
A workaround for this limitation is to create batches of ‘Events’ by filtering the event streams based on Type and Create Time.
For example in our Apache-SSLBlackBox-V2.0-EVENTS event feed select the
 icon.
icon.
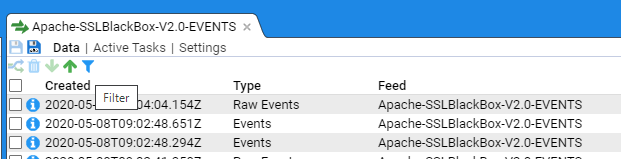
Filter the feed by errors and creation time. Then click OK.
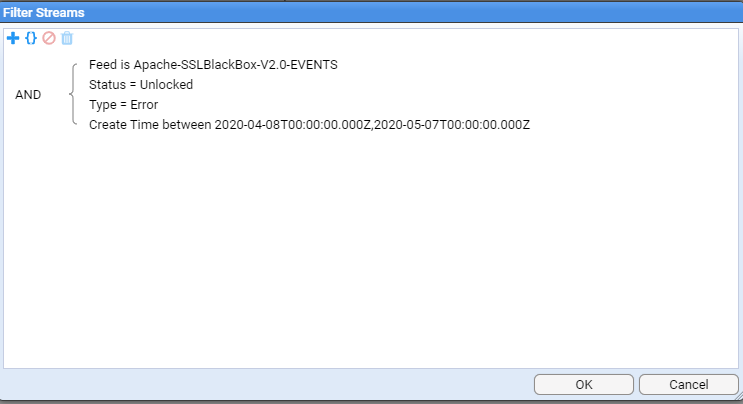
You will need to adjust the create time range until you get the number of event streams displayed in the feed window below 1000.
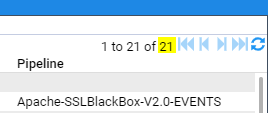
Once you are displaying less than 1000 streams you can select all the streams in your filtered selection by clicking in the topmost check box.
Then click on the
icon to reprocess these streams.
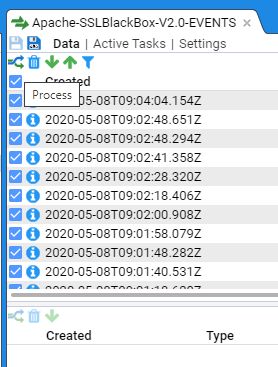
Repeat the process in batches of less that 1000 until your entire error stream backlog has been reprocessed.
In a worst case senario, one can also delete a set of streams for a given time period and then reprocess them all. The only risk here is that if there are other pipelines that trigger on Event creation, you will activate them.
The reprocessing may result in having two index entries in an index. Stroom dashboards can silently cater for this, or you may chose to re-flatten data to some external downstream capability.
When considering reprocessing streams there are some other ‘downstream effects’ to be mindful of.
If you have indexing in place, then additional index documents will be added to the index as the indexing capability does not replace documents, but adds them. If there are only a small number of streams reprocessed then there should not be too big an index storage impost, but should a large number of streams be reprocessed, then consideration of rebuilding resultant indices may need to be considered.
If the pipeline exports data for consumption by another capability, then you will have exported a portion of the data twice. Depending on the risk of downstream data duplication, you may need to prevent the export or the consumption of the export. Some ways to address this can vary from creating a new pipeline to reprocess the errant streams which does not export data, to temporarily redirecting the export destination whilst reprocessing and preventing ingest of new source data to the pipeline at the same time.
2 - Explorer Management
Moving a set of Objects
The following shows how to create a System Folder(s) within the Explorer tree and move a set of objects into the new structure. We will create the system group GeoHost Reference and move all the GeoHost reference feed objects into this system group. Because Stroom Explorer is a flat structure you can move resources around to reorganise the content without any impact on directory paths, configurations etc.
Create a System Group
First, move your mouse over the Event Sources object in the explorer, single click to highlight this object to highlight, you will see
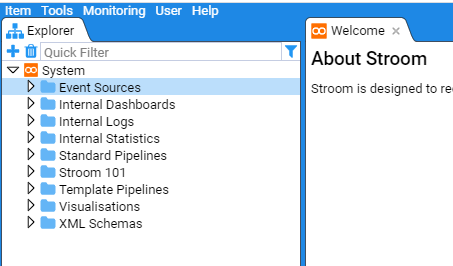
Now right click to bring up the object context menu
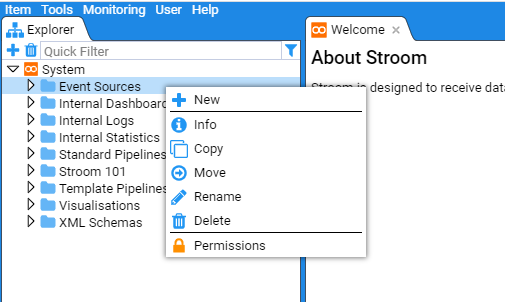
Next move the mouse over the
New icon to reveal the New sub-context menu.
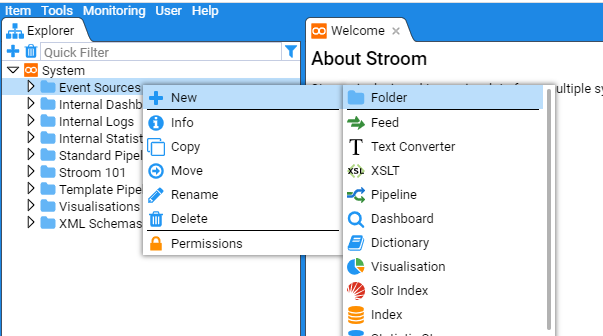
Click on the folder
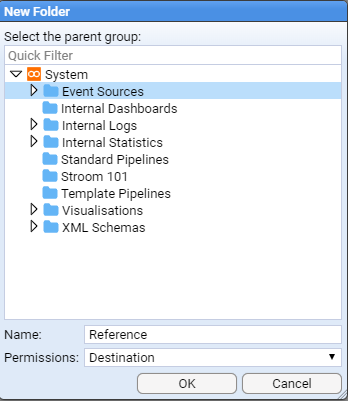
 icon, at which point the New Folder selection window will be presented
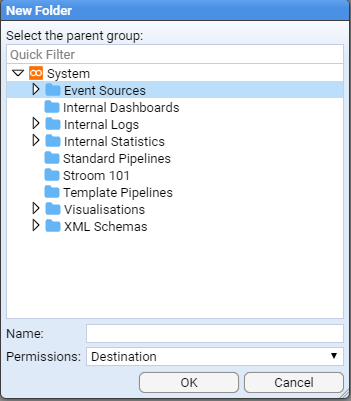
We will enter the name Reference into the Name: entry box
With the newly created Reference folder highlighted, repeat the above process but use the folder Name: of GeoHost
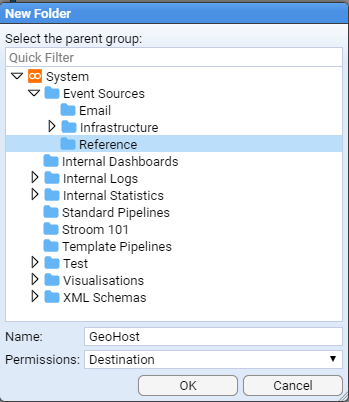
then click to save.
Note that we could have navigated within the explorer tree but as we want the Reference/GeoHost system group at the top level of the Event Sources group, there is no need to perform any navigation.
Had we needed to, double click any system group that contains objects, indicated by the icon and to select the system group you want to store your new group in, just left or right click the mouse once over the group to select it.
You will note that the Event Sources system group was selected above.
At this point, our new folders will display in the main pane.
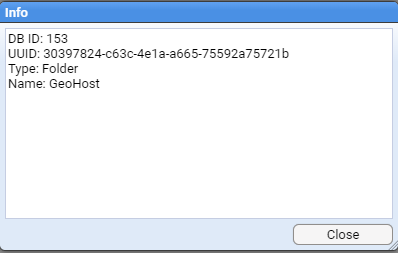
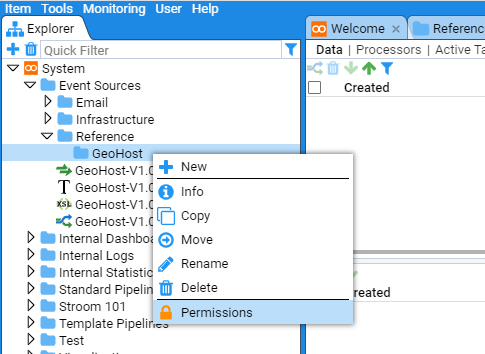
You can look at the folder properties by selecting the desired folder, right clicking and choosing Info option

This will return a window with folder specific information
Should you wish to limit the users who can access this folder, you similarly select the desired folder, right click and choose Permissions
You can limit folder access as required in the resultant window.
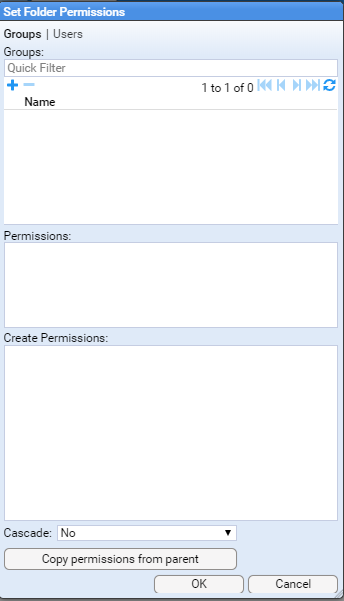
Make any required changes and click on to save the changes.
Moving Objects into a System Group
Now you have created the new folder structure you can move the various GeoHost resources to this location.
Select all four resources by using the mouse right-click button while holding down the Shift key. Then right click on the highlighted group to display the action menu
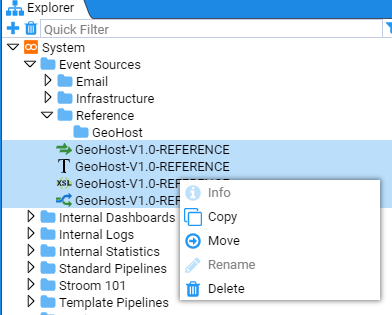
Select move
 and the Move Multiple Items window will display.
Navigate to the
and the Move Multiple Items window will display.
Navigate to the Reference/GeoHost folder to move the items to this destination.
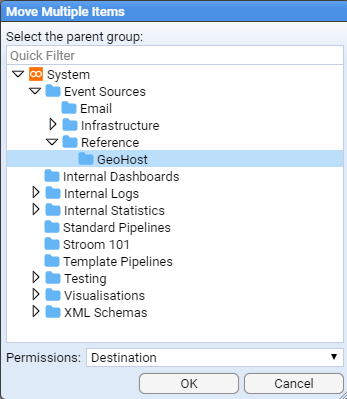
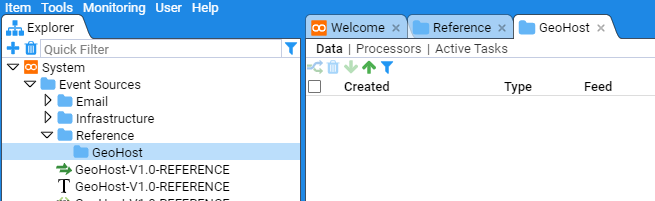
The final structure is seen below
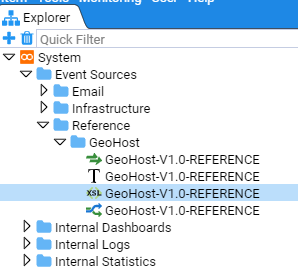
Note that when a folder contains child objects this is indicated by a folder icon with an arrow to the left of the folder.
Whether the arrow is pointing right
 or down
 indicates whether or not the folder is expanded.
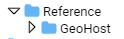
The GeoHost resources move has now been completed.
3 - Feed Management
This HOWTO demonstrates how to manage Feeds
Assumptions
- All Sections
- an account with the
AdministratorApplication Permission is currently logged in.
- an account with the
Creation of an Event Feed
We will be creating an Event Feed with the name TEST-FEED-V1_0.
Once you have logged in, move the cursor to the System folder within the Explorer tab and select it.
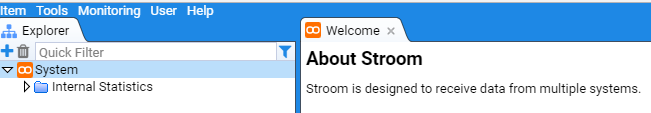
Once selected, right click to bring up the New Item selection sub-menu. By selecting the System folder we are
requesting any new item created to be placed within it.
Select

You will be presented with a New Feed configuration window.
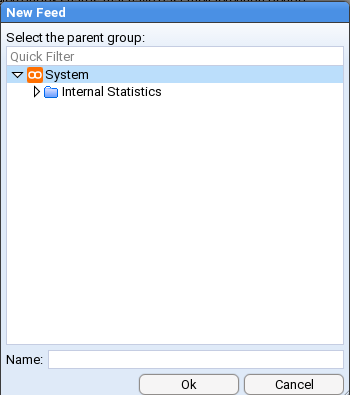
You will note that the System folder has already been selected as the parent group and all we need to do is enter our feed’s name in the Name: entry box
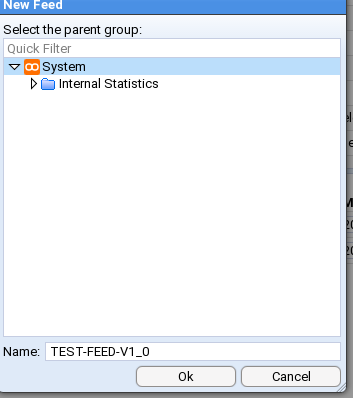
On pressing
we are presented with the Feed tab for our new feed. The tab is labelled with the feed name TEST-FEED-V1_0.
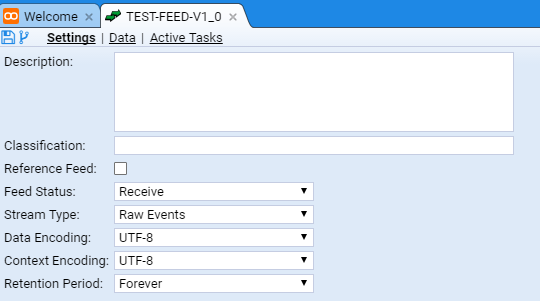
We will leave the definitions of the Feed attributes for the present, but we will enter a Description: for our feed as we should ALWAYS do this fundamental tenet of data management - document the data. We will use the description of ‘Feed for installation validation only. No data value’.
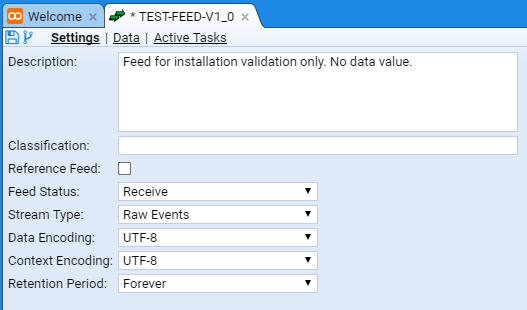
One should note that the
* TEST-FEED-V1_0
×
tab has been marked as having unsaved changes.
This is indicated by the asterisk character * between the Feed icon
and the name of the feed TEST-FEED-V1_0.
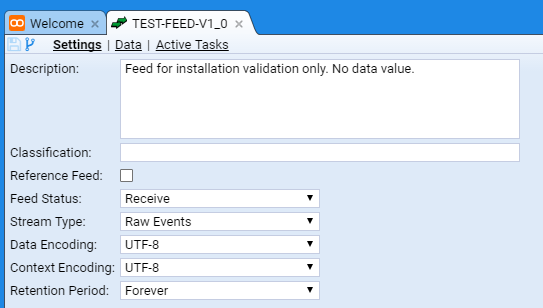
We can save the changes to our feed by pressing the Save icon
 in the top left of the
 TEST-FEED-V1_0 tab. At this point one should notice two things, the first is that the asterisk
has disappeared from the Feed tab and the Save icon
![]() is ghosted.
is ghosted.
Folder Structure for Event Sources
In order to simplify the management of multiple event sources being processed by Stroom, it is suggested that an Event Source folder is created at the root of the System folder
 in the
 Explorer tab.
This can be achieved by right clicking on the
System root folder and selecting:
You will be presented with a New Folder configuration window.
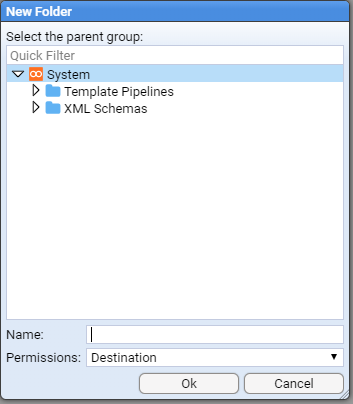
You will note that the System folder has already been selected as the parent group and all we need to do is enter our folders’s name in the Name: entry box
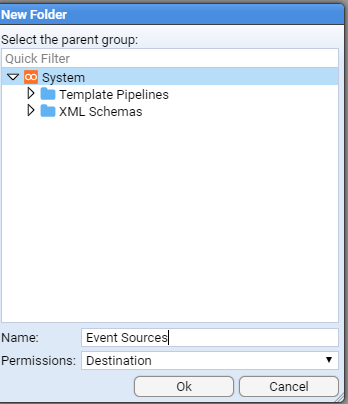
On pressing
we are presented with the
 Event Sources
×
tab for our new folder.
Event Sources
×
tab for our new folder.

You will also note that the Explorer tab has displayed the Event Sources folder in its display.
Create Folder for specific Event Source
In order to manage all artefacts of a given Event Source (aka Feed), one would create an appropriately named sub-folder within the Event Sources folder structure.
In this example, we will create one for a BlueCoat Proxy Feed.
As we may eventually have multiple proxy event sources, we will first create a Proxy folder in the Event Sources before creating the desired BlueCoat folder that will hold the processing components.
So, right-click on the
Event Sources folder in the Explorer tree and select:
You will be presented with a New Folder configuration window.
Enter Proxy as the folder Name:
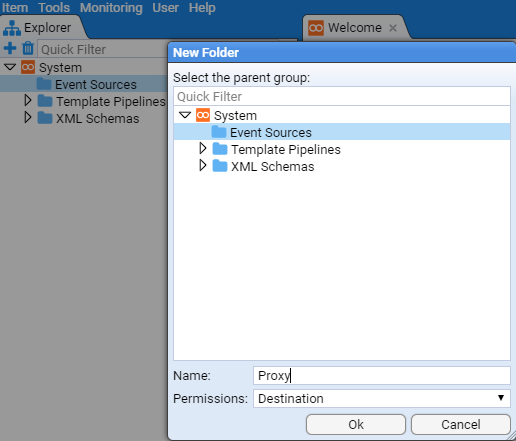
and press .
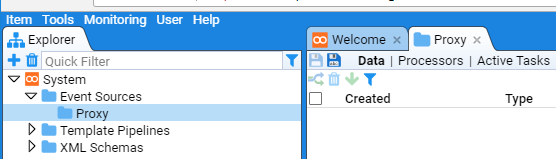
At this you will be presented with a new
Proxy
×
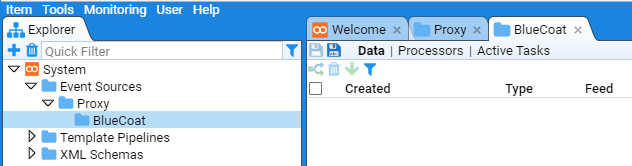
tab for the new sub-folder and we note that it has been added below the Event Sources folder in the Explorer tree.
Repeat this process to create the desired BlueCoat sub-folder with the result
.
4 - Raw Source Tracking
Stroom v6.1 introduced a new feature (stroom:source()) to allow a translation developer to obtain positional details of the source file that is currently being processed. Using the positional information it is possible to tag Events with sufficient details to link back to the Raw source.
Assumptions
- You have a working pipeline that processes logs into Events.
- Events are indexed
- You have a Dashboard uses a Search Extraction pipeline.
Steps
-
Create a new XSLT called Source Decoration containing the following:
<xsl:stylesheet
    xpath-default-namespace="event-logging:3"
    xmlns:sm="stroom-meta" xmlns="event-logging:3"
    xmlns:rec="records:2"
    xmlns:stroom="stroom"
    version="3.0"
    xmlns:xsl="http://www.w3.org/1999/XSL/Transform">
  <xsl:template match="@*|node()">
    <xsl:copy>
      <xsl:apply-templates select="@*|node()" />
    </xsl:copy>
  </xsl:template>
  <xsl:template match="Event/Meta[not(sm:source)]">
    <xsl:copy>
      <xsl:apply-templates />
      <xsl:copy-of select="stroom:source()" />
    </xsl:copy>
  </xsl:template>
  <xsl:template match="Event[not(Meta)]">
    <xsl:copy>
      <xsl:element name="Meta">
        <xsl:copy-of select="stroom:source()" />
      </xsl:element>
      <xsl:apply-templates />
    </xsl:copy>
  </xsl:template>
</xsl:stylesheet>
This XSLT will add or augment the Meta section of the Event with the source details.
-
Insert a new XSLT filter into your translation pipeline after your translation filter and set it to the XSLT created above.
-
Reprocess the Events through the modified pipeline, also ensure your Events are indexed.
-
Amend the translation performed by the Extraction pipeline to include the new data items that represent the source position data. Add the following to the XSLT:
<xsl:element name="data"> <xsl:attribute name="name"> <xsl:text>src-id</xsl:text> </xsl:attribute> <xsl:attribute name="value" select="Meta/sm:source/sm:id" /> </xsl:element> <xsl:element name="data"> <xsl:attribute name="name"> <xsl:text>src-partNo</xsl:text> </xsl:attribute> <xsl:attribute name="value" select="Meta/sm:source/sm:partNo" /> </xsl:element> <xsl:element name="data"> <xsl:attribute name="name"> <xsl:text>src-recordNo</xsl:text> </xsl:attribute> <xsl:attribute name="value" select="Meta/sm:source/sm:recordNo" /> </xsl:element> <xsl:element name="data"> <xsl:attribute name="name"> <xsl:text>src-lineFrom</xsl:text> </xsl:attribute> <xsl:attribute name="value" select="Meta/sm:source/sm:lineFrom" /> </xsl:element> <xsl:element name="data"> <xsl:attribute name="name"> <xsl:text>src-colFrom</xsl:text> </xsl:attribute> <xsl:attribute name="value" select="Meta/sm:source/sm:colFrom" /> </xsl:element> <xsl:element name="data"> <xsl:attribute name="name"> <xsl:text>src-lineTo</xsl:text> </xsl:attribute> <xsl:attribute name="value" select="Meta/sm:source/sm:lineTo" /> </xsl:element> <xsl:element name="data"> <xsl:attribute name="name"> <xsl:text>src-colTo</xsl:text> </xsl:attribute> <xsl:attribute name="value" select="Meta/sm:source/sm:colTo" /> </xsl:element> -
Open your dashboard, now add the following custom fields to your table:
${src-id}, ${src-partNo}, ${src-recordNo}, ${src-lineFrom}, ${src-lineTo}, ${src-colFrom}, ${src-colTo} -
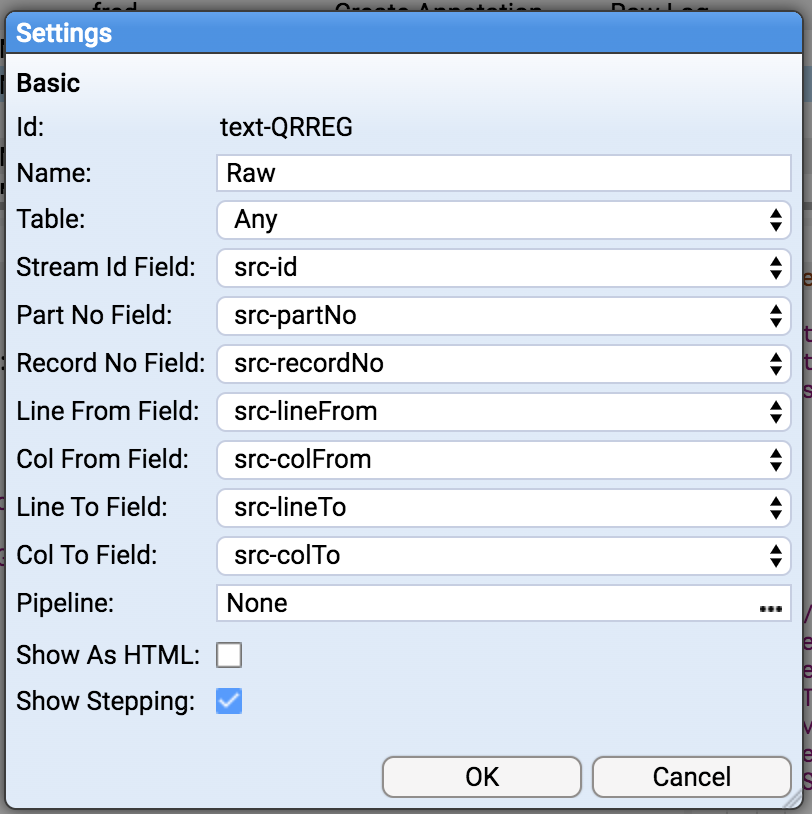
Now add a New Text Window to your Dashboard, and configure it as below:
-
You can also add a column to the table that will open a data window showing the source. Add a custom column with the following expression:
data('Raw Log',${src-id},${src-partNo},'',${src-lineFrom},${src-colFrom},${src-lineTo},${src-colTo})
5 - Task Management
Various Tasks run in the background within Stroom. This HOWTO demonstrates how to manage these tasks
Assumptions
- All Sections
- an account with the
AdministratorApplication Permission is currently logged in.
- an account with the
- Proxy Aggregation Tasks
- we have a multi node Stroom cluster with two nodes,
stroomp00andstroomp01.
- we have a multi node Stroom cluster with two nodes,
- Stream Processor Tasks
- we have a multi node Stroom cluster with two nodes,
stroomp00andstroomp01. - when demonstrating adding a new node to an existing cluster, the new node is
stroomp02.
- we have a multi node Stroom cluster with two nodes,
Proxy Aggregation
Turn Off Proxy Aggregation
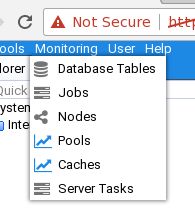
We first select the Monitoring item of the Main Menu to bring up the Monitoring sub-menu.
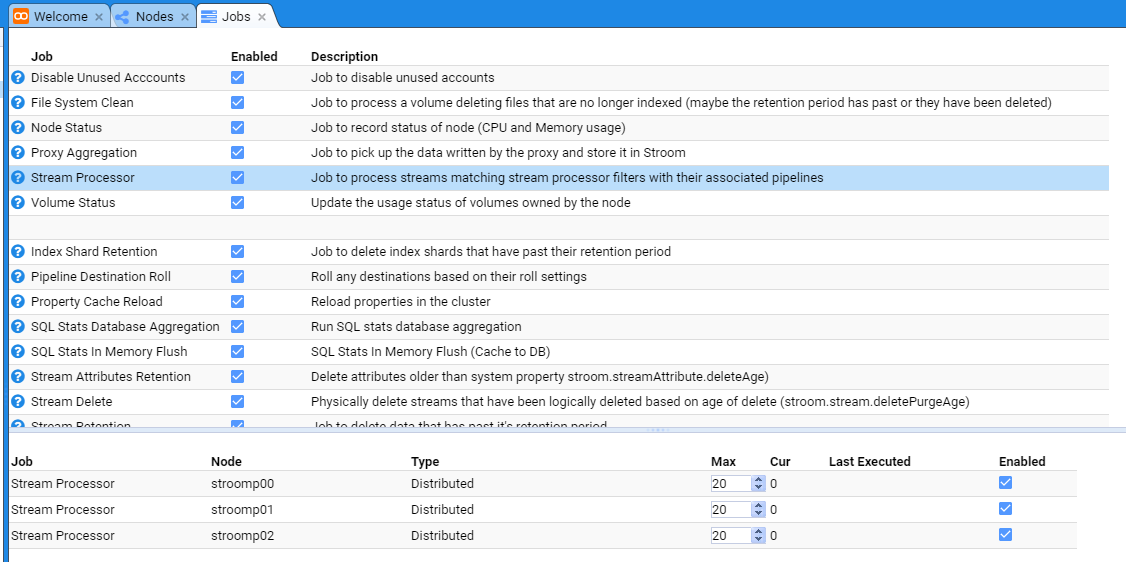
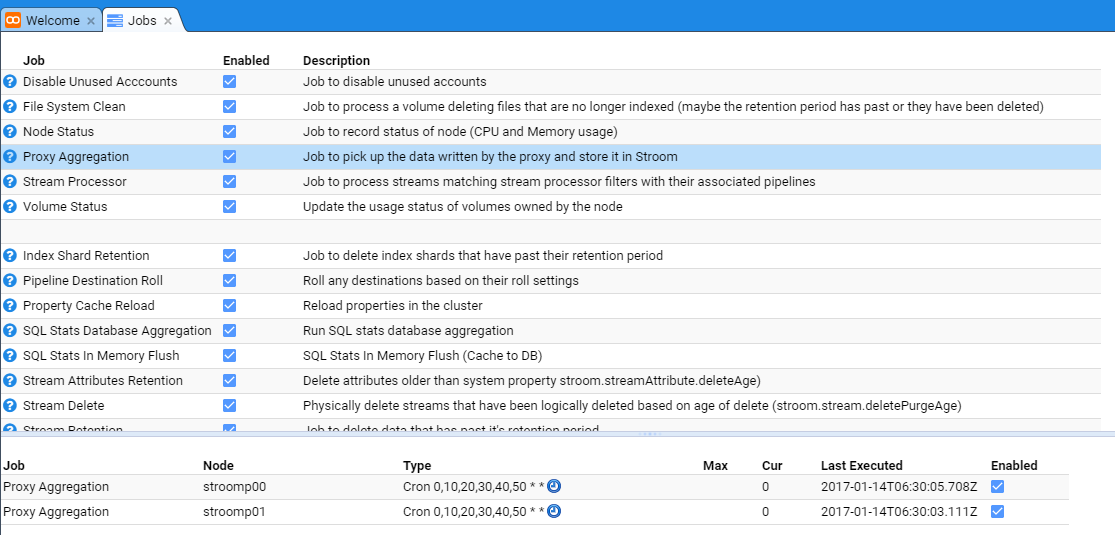
then move down and select the Jobs sub-item to be presented with the Jobs configuration tab as seen below.
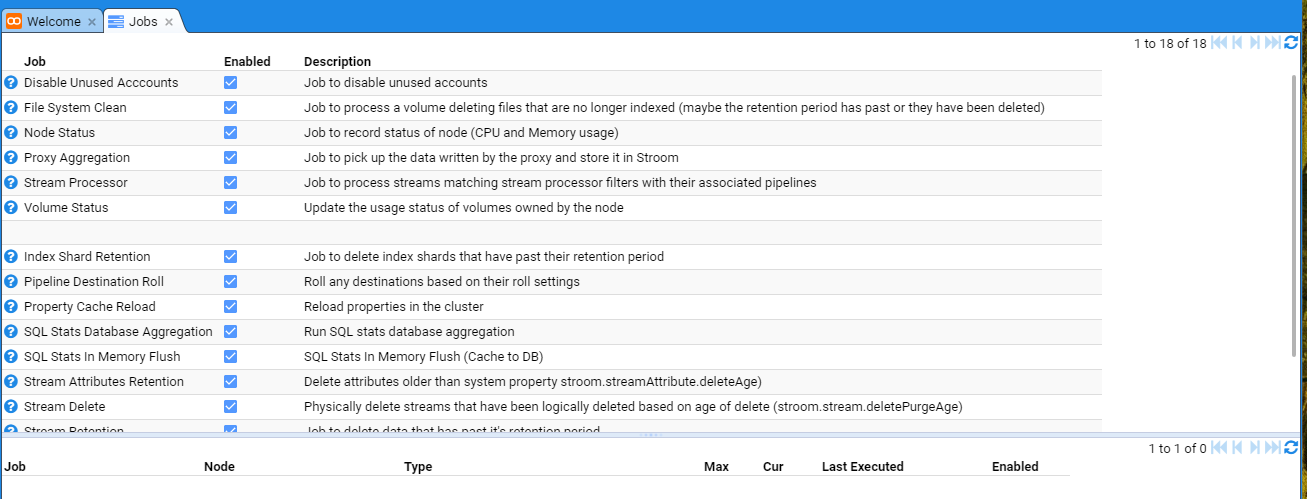
At this we can select the Proxy Aggregation Job whose check-box is selected and the tab will show the individual Stroom Processor nodes
in the deployment.
At this, uncheck the Enabled check-boxes for both nodes and also the main Proxy Aggregation check-box to see.
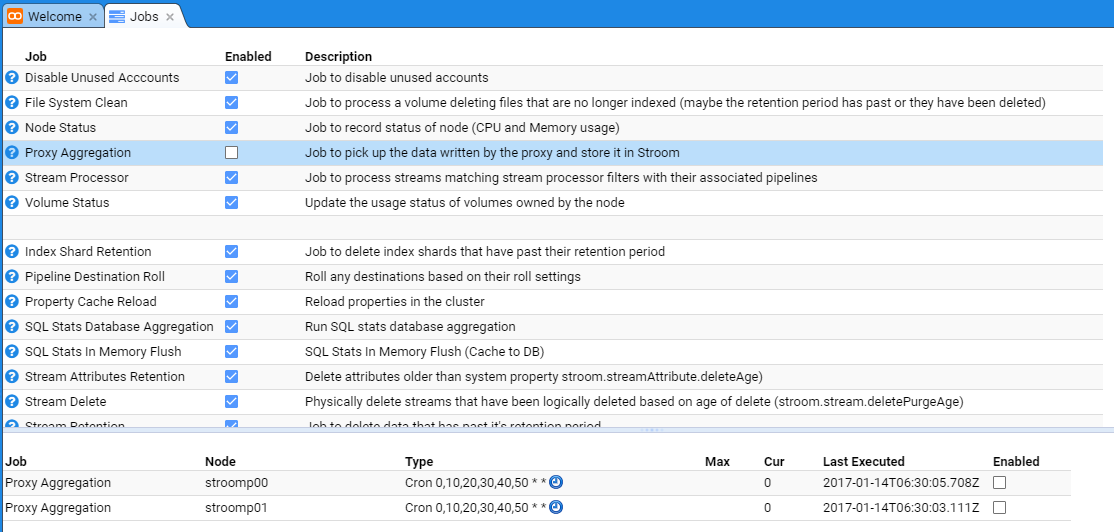
At this point, no new proxy aggregation will occur and any inbound files received by the Store Proxies will accumulate in the proxy storage area.
Turn On Proxy Aggregation
We first select the Monitoring item of the Main Menu to bring up the Monitoring sub-menu.
then move down and select the Jobs sub-item then select the Proxy Aggregation Job to be presented with the Jobs configuration tab as seen below.
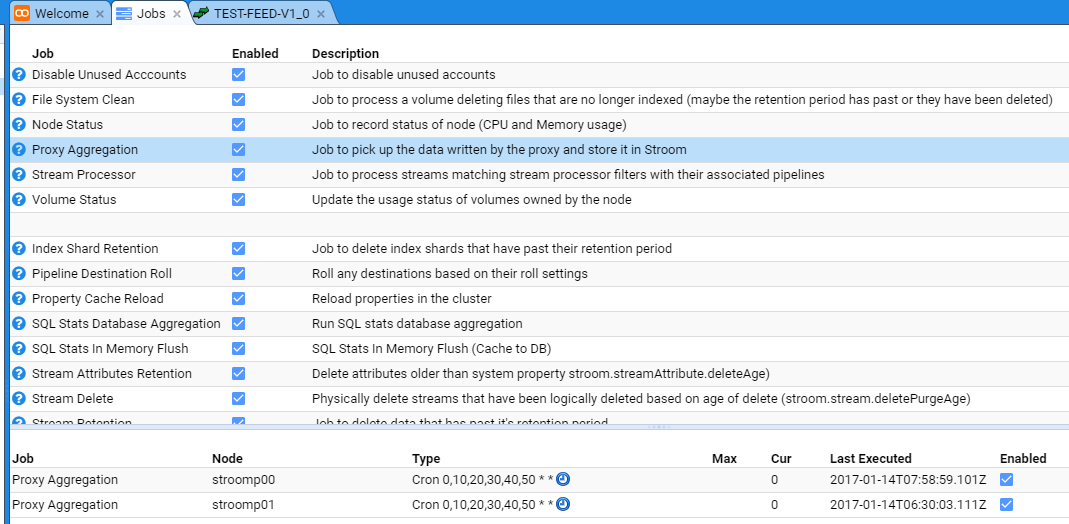
Now, re-enable each node’s Proxy Aggregation check-box and the main Proxy Aggregation check-box.
After checking the check-boxes, perform a refresh of the display by pressing the Refresh icon
.
on the top right of the lower (node display) pane. You should note the Last Executed date/time change to see
Stream Processors
Enable Stream Processors
To enable the Stream Processors task, move to the Monitoring item of the Main Menu and select it to bring up the Monitoring sub-menu.
then move down and select the Jobs sub-item to be presented with the Jobs configuration tab as seen below.
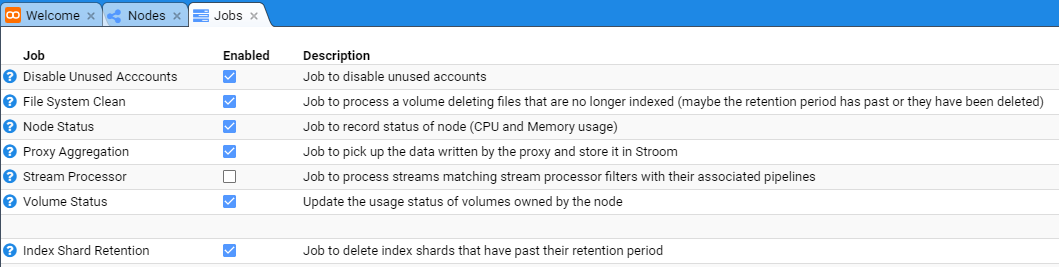
At this, we select the Stream Processor Job whose check-box is not selected and the tab will show the individual Stroom Processor
nodes in the Stroom deployment.
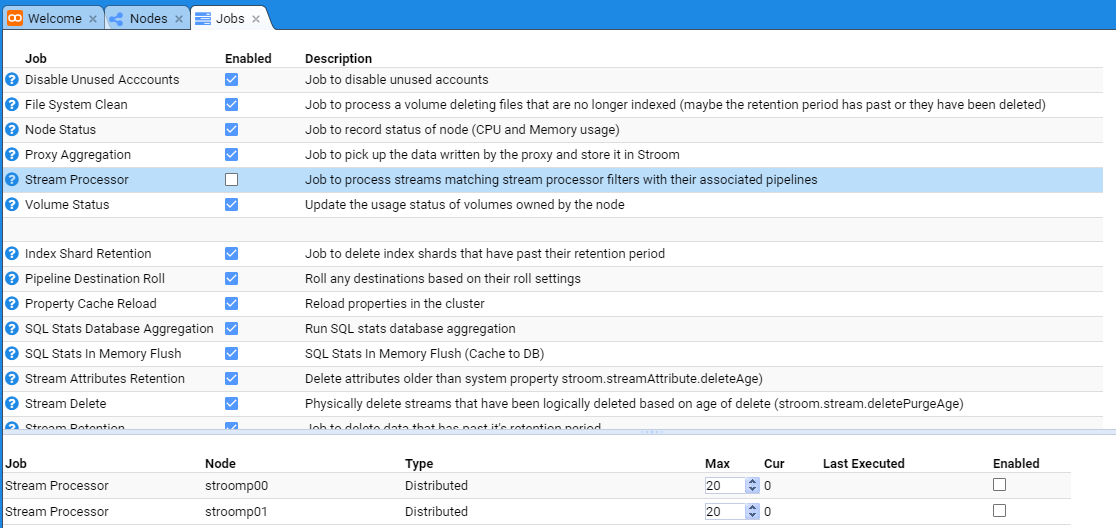
Clearly, if it was a single node Stroom deployment, you would only see the one node at the bottom of the Jobs configuration tab.
We enable nodes nodes by selecting their check-boxes as well as the main Stream Processors check-box. Do so.
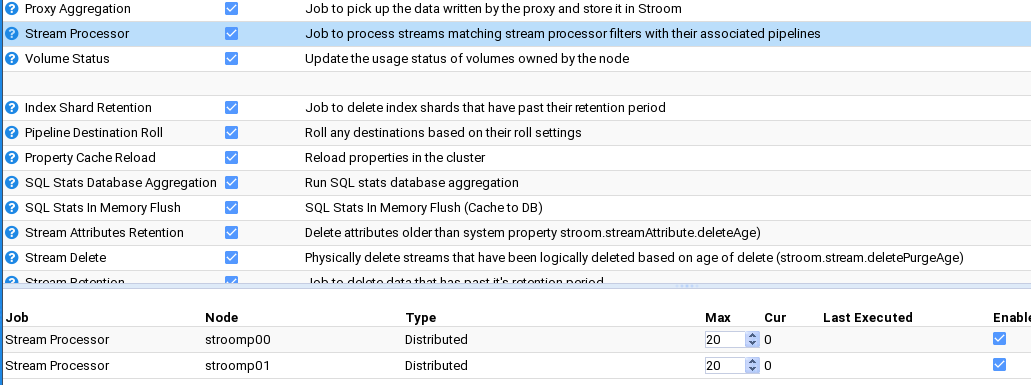
That is it. Stroom will automatically take note of these changes and internally start each node’s Stroom Processor task.
Enable Stream Processors On New Node
When one expands a Multi Node Stroom cluster deployment, after the installation of the Stroom Proxy and Application software and
services on the new node, we need to enable it’s Stream Processors task.
To enable the Stream Processors for this new node, move to the Monitoring item of the Main Menu and select it to bring up the Monitoring sub-menu.
then move down and select the Jobs sub-item to be presented with the Jobs configuration tab as seen below.
At this we select the Stream Processor Job whose check-box is selected
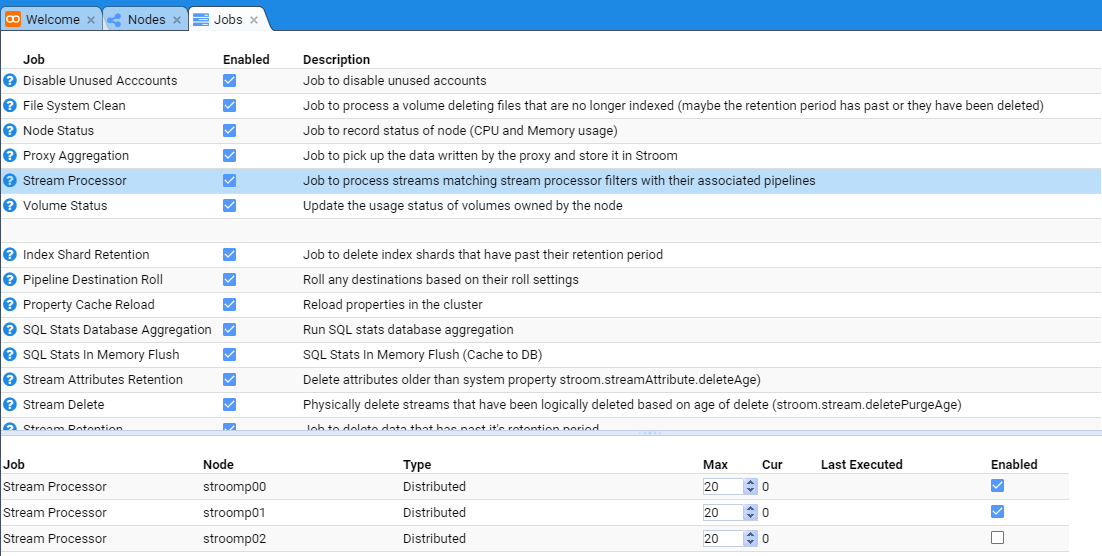
We enable the new node by selecting it’s check-box.